- The weekly price chart of Bitcoin has shown a bearish technical pattern, as the 50-week simple moving average has crossed under the 200-week SMA.
- Some analysts believe the 50-week moving average acts as valid resistance, intensifying the selling.
- Others do not consider the death cross a reliable indicator, as it is based on backward-looking moving averages and lags prices.
Bitcoin faces a new challenge as the market sees a weekly “death cross” printed on the charts. The timing seems to favor the bears as the asset experienced a nearly 5% drop last week, but is Bitcoin really in danger of crashing again?
For the second week in a row, Bitcoin is encountering a sell wall at the 50-week SMA. Despite this, analysts have had varying opinions on what the direction is for the price action of the cryptocurrency.
Analysts Weigh in on the Bitcoin “Death Cross”
Some analysts are raising concerns about a technical market analysis phenomenon called the “death cross.” This occurs when a chart displays an asset’s 50-day moving average price falling below its 200-day moving average.
Sponsored
Market analyst Alex Kuptsikevich believes that the 50-week moving average continues to act as a valid resistance and states that the death cross formed on the weekly timeframe makes for a cautious view of the near-term outlook and keeps the potential for a return to the $18,000-$16,300. However, some observers do not share the same opinion and consider the death cross unreliable as an indicator.
Investment manager Timothy Peterson at Cane Island Alternative Investments tweeted, “A death cross is a non-event…They are lagging indicators that definitionally occur after a rapid decline.”
Peterson also noted that the death cross has been unreliable as a standalone indicator in traditional markets for many years. Despite these opinions, Bitcoin has managed to maintain its position, at least for the time being.
Bitcoin Loses Its Bullish Structure
Bitcoin’s price has been on an upward trajectory since the start of the year, supported by an ascending support line. On February 21st, it broke above the $23,800 resistance area, reaching a yearly high of $25,250. However, this bullish trend has since come to a halt as BTC’s price has fallen and broke down from the ascending support line on March 3rd.
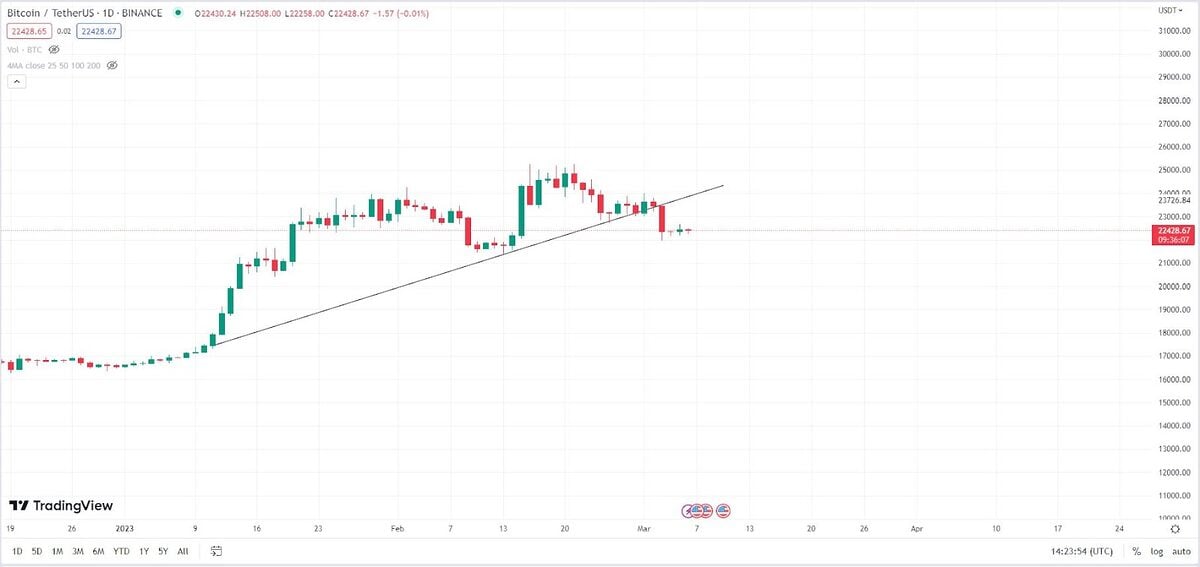
Bitcoin Daily Price Chart. Source: Tradingview
If the decline continues, the likely future price scenario is for the 0.5 Fibonacci retracement level at $20,850 to provide support. Alternatively, if the cryptocurrency recovers the $23,800 resistance level, it could continue upward toward $27,000.
On the Flipside
- The cryptocurrency market is known for its unpredictability, and the signals presented by technical charts can often be disrupted, altering the market’s outlook.
- It’s important to note that technical indicators do not always provide a guaranteed signal for future price movements, as opposing market sentiment can lead to unexpected outcomes.
- Although technical analysis is a standard method for predicting price movements, it’s worth remembering that all charts can be interpreted differently. As such, DailyCoin does not offer financial advice, and investors must conduct due diligence and research before making investment decisions.
Why You Should Care
Bitcoin’s movements often define the overall direction of the sector. The recent appearance of a “death cross,” a bearish indicator on Bitcoin’s weekly price chart, suggests that the short-term price pullback could become a more sustained downtrend. However, the pattern’s reliability is still up for debate.
To get caught up with the Bitcoin price action, read here:
Bitcoin Comes Up Short at $23,650, Ethereum Faces Rough Seas
There has been an influx in stablecoin inflows which could suggest buying pressure read more about it here:
Stablecoin Inflows to Crypto Exchanges: Are Buyers Bullish?