
- Bitcoin has been attempting to break above the resistance level at $23,650.
- Ethereum has grown slowly after rebounding from the $1,565 support zone.
- Technical indicators show bullish signs for BTC and indecision for ETH.
The price of Bitcoin has shown potential signs of breaking above the $23,650 resistance level, with the need to clear the $24,000 resistance for a steady increase in the near term.
As of this writing, the price has been trading below $23,500 and the 100 hourly moving average. However, the BTC/USD pair has broken above a key bearish trend line near $23,300 on the hourly chart, indicating a positive trend.
Bitcoin Attempts to Build Momentum
If the BTC/USD pair steadily rises to clear the $23,650 and $24,000 resistance levels, it may head towards the $24,600 resistance zone, with the main hurdle near the $25,000 zone.
Sponsored
However, if the price of Bitcoin fails to break the resistance in the short term, a slow decline would be the most likely outcome. In this scenario, the leading asset would find immediate support near the $23,220 mark, followed by $22,750. This is a further possibility if technical indicators show bearishness as well.
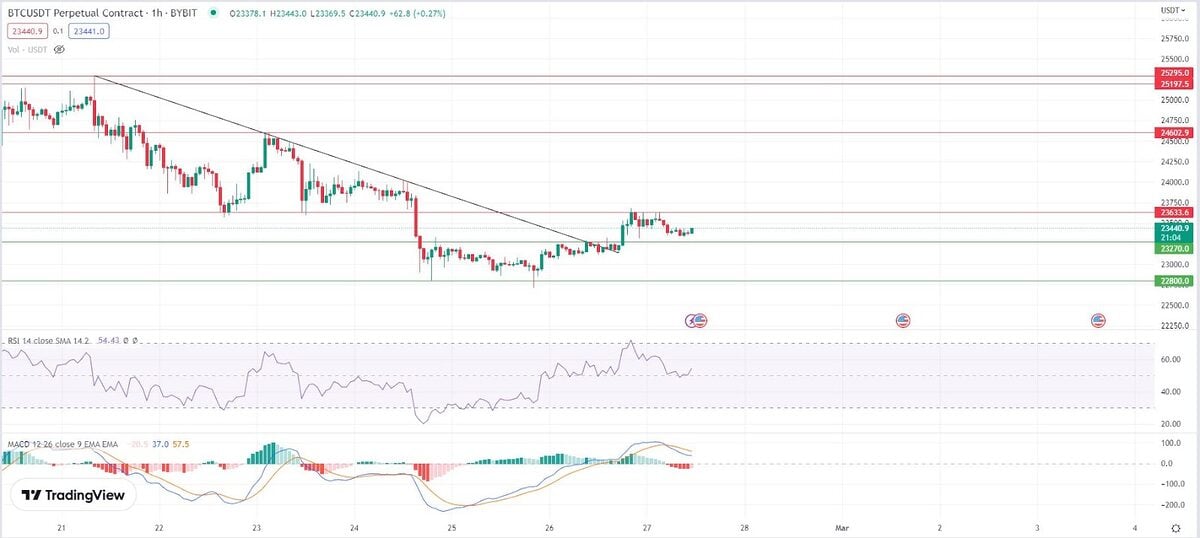
1-Hour Price Chart for Bitcoin. Source: Tradingview
MACD and RSI Strength
One widely used indicator in identifying momentum and trend changes in an asset’s price is the Moving Average Convergence Divergence (MACD). The MACD is currently demonstrating upward momentum for the BTC/USD pair. When the MACD is in the bullish zone, the cryptocurrency’s price gains upward momentum, generally considered positive.
Another widely used technical indicator is the Relative Strength Index (RSI) which measures the strength of an asset’s price movement. At press time, the RSI for BTC/USD is above 50. An RSI value in this range suggests that buying pressure is stronger than selling pressure. Bitcoin has historically been a leading indicator for many Altcoins, but Ethereum recently started to move independently. Is that still the case this time?
Ethereum Rebounds from $1,565 Support
The Ethereum price is slowly climbing above the $1,620 resistance level against the US Dollar, and it needs to break through the $1,650 and $1,670 resistance levels to continue higher in the short term.
After reaching the crucial $1,565 support zone, Ethereum has gradually been recovering, trading above $1,620 at the time of writing, which is higher than the 100-hour simple moving average. There was a significant bearish trend line breakthrough on the hourly chart of ETH/USD, with resistance near $1,615.
If ETH/USD continues the bullish trend and clears the $1,650 and $1,670 resistance levels, it could undergo a short-term rally. Once the $1,670 zone has been broken, the next resistance level to watch would be $1,700.
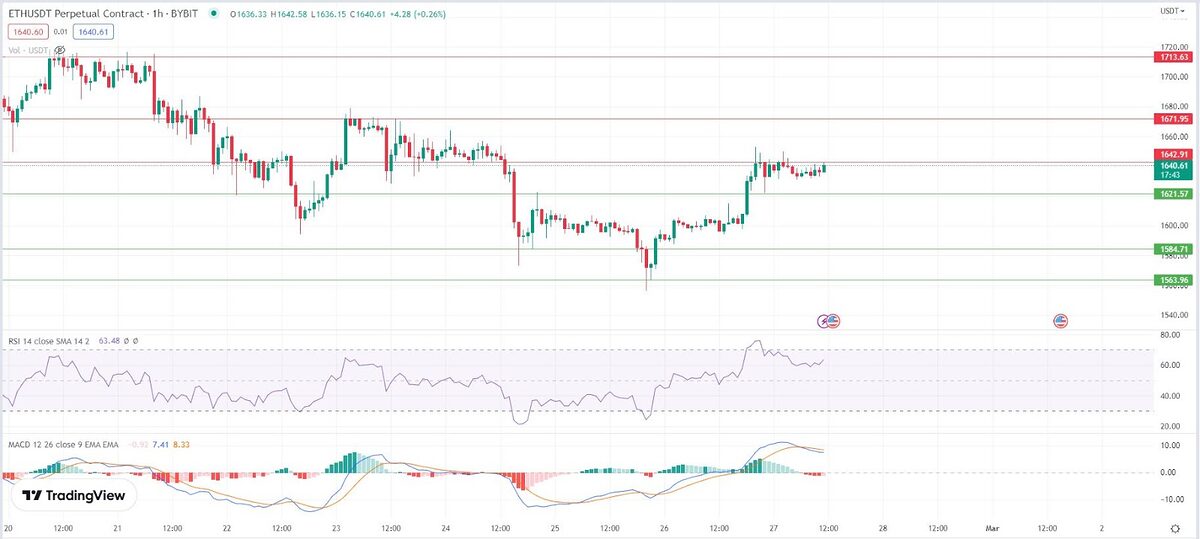
1-Hour Price Chart for Ethereum. Source: Tradingview
Ethereum is still trading within an expanding triangle formation, which presents significant resistance above. If the price manages to break through this level, it could initiate a steady increase toward the $1,800 level, with further gains opening the doors for a move toward the $1,880 level.
Ethereum risks triggering further downward correction if it fails to surpass the $1,670 resistance level. In this case, the immediate support level rests at $1,620, followed by the major support near the $1,585 zone.
If the price breaks below $1,585, it could further decrease towards the $1,565 support, with any bearish continuation possibly leading to a test of the $1,500 level.
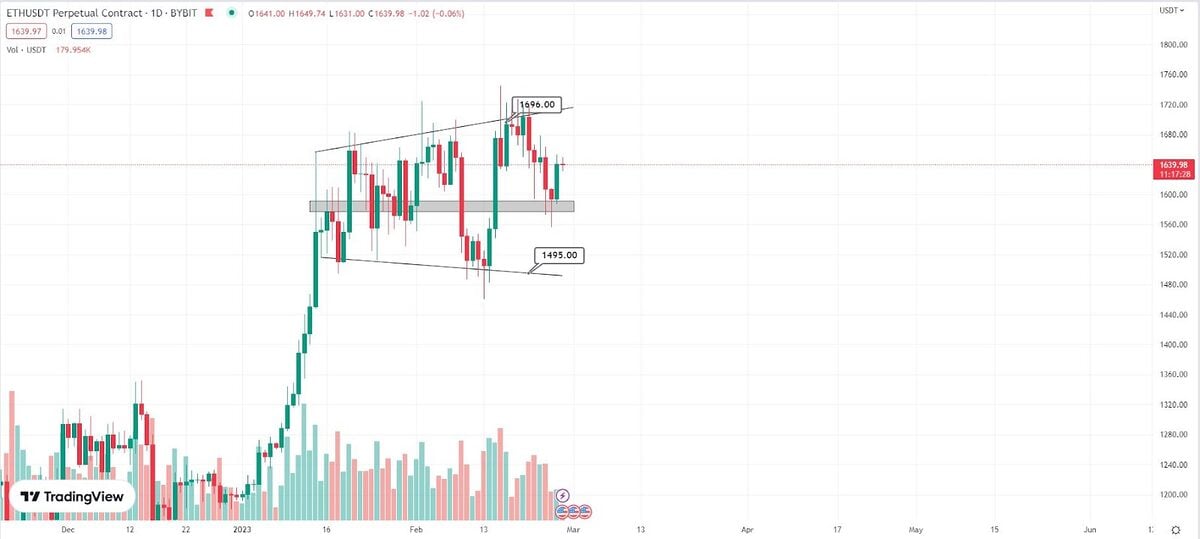
Ethereum 1-Day Price Chart. Source: Tradingview
Indecisive Technicals
As for the technical indicators, the MACD is within the bullish zone for the ETH/USD pair, However, it is starting to lose momentum. The RSI, on the other hand, is above the 50 level, indicating buying pressure is currently stronger than selling pressure.
On the Flipside
- Technical indicators do not always provide a reliable signal for future price movements, as opposing market sentiment can result in unexpected outcomes.
- Although technical analysis is a common method for predicting price movements, charts have multiple interpretations.
- DailyCoin does not offer financial advice and always encourages users to conduct their own research and due diligence.
Why You Should Care
Bitcoin and Ethereum are leaders in the crypto market. As such, their movements often define the overall direction of the sector and should be monitored closely. Significant movements in their prices consistently cause a ripple effect on other cryptocurrencies and the market as a whole.
To get caught up with the Bitcoin price action, read here:
Why the Market is Down with Bitcoin Options Expiring
If you are wondering how the Ethereum price arrived here, read this:
Bitcoin Eyes 25K Summit, Ethereum Climbs the Peak Too