
- Historical precedence suggests a coming altcoin run.
- Some analysts expect altcoins to run rampant this cycle.
- Bitcoin dominance has waned recently.
The crypto market has steadily recovered since Q4 2023, with the altcoin market cap nearly doubling over the past five months. As the market continues to gather momentum, analyst “Mags” shared his Relative Strength Index (RSI) analysis, declaring that the stage is set for another massive altcoin bull run.
Altcoins Poised to Explode?
In a recent X post, Mags expressed altcoin bullishness due to the RSI indicator hovering just below 70 on the two-week timeframe. Altcoins will “go parabolic” once the cross above 70 is complete, declared the analyst.
Mags bases this forecast on historical precedence from the prior bull market, when the RSI crossed above 70, leading to an explosion in the altcoin market cap from $90 billion to $1 trillion beginning in late 2020.
While Mags predicted the cross above 70 on the altcoin RSI would happen soon, he also cautioned that short-term fluctuations are likely to happen, particularly as his chart is working on a two-week timeframe. Nonetheless, Mags maintained that “the big picture looks incredibly bullish.”
Stockmoney Lizards echoed Mags’ take, noting that the altcoin market cap’s recent successful retest of $730 billion support has increased the probability of a repeat of late 2020’s 10x run playing out. This would put the altcoin market top at a lofty $10 trillion, according to Stockmomney Lizards.
Sponsored
For altcoins to pop off as Mags and Stockmoney Lizards predicted, Bitcoin Dominance (BTC.D) will need to contract.
Bitcoin Dominance Wanes
Explosive altcoin runs are met with contracting BTC.D, as capital rotates from the market leader into the higher-beta alts. The past two weeks have seen BTC.D fall from a local top of 54.03% to a current reading of 52.88%. The zone around 54.4% has proven strong resistance, with BTC.D failing to close above this level on four occasions recently.
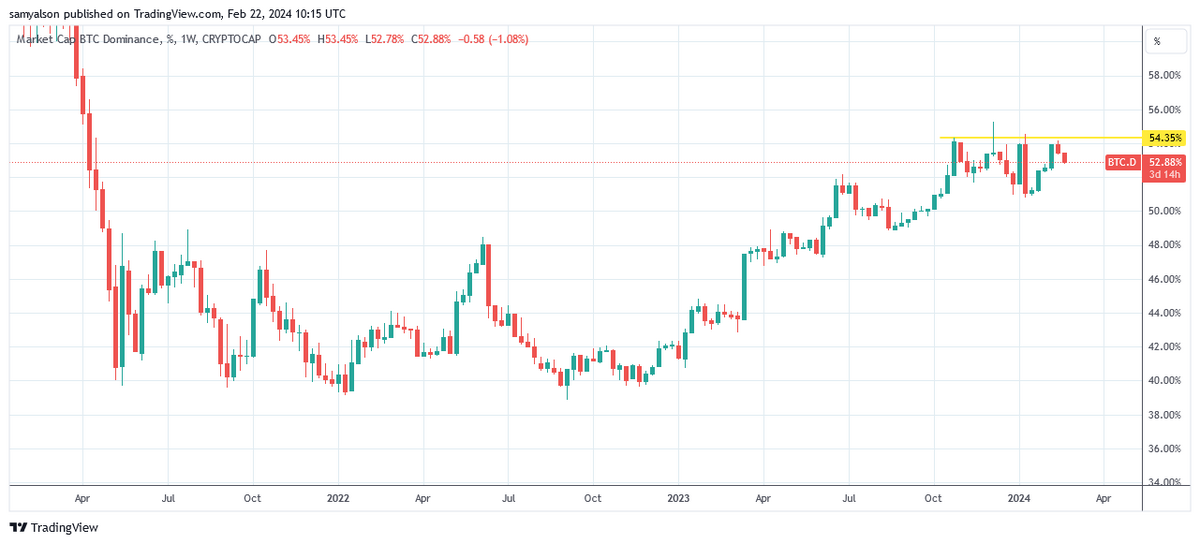
With BTC.D seemingly on the retreat, Mags and Stockmoney Lizards’ predictions of a coming altcoin run are lining up.
On the Flipside
- Using a single indicator, such as RSI, to dictate trading or investment strategy places a limit on information.
- Technical analysis continues to divide opinion on its accuracy, particularly as an event can have multiple interpretations.
- Altseason does not have a single definition. Blockchain Center defines it as 75% of the top 50 coins outperforming BTC over the last 90 days.
Why This Matters
Bullish altcoin forecasts resonate with a growing sentiment that the crypto space is poised for unprecedented growth, making this analysis an optimistic take for market participants.
The total crypto market cap hits $2 trillion, marking a 98-week high; read more here:
Total Crypto Market Cap Tops $2T to Recapture Milestone
Find out the Litecoin Foundation’s take on stagnant LTC price action here:
Litecoin Addresses Stagnant LTC Price Frustrations