- A candlestick is an essential tool for crypto trading. It shows the price movement of a particular currency.
- There are different types of candlestick patterns. A cheat sheet will help you quickly identify the type of pattern you have.
- You can also use candlestick patterns in stock and futures trading
When we’re talking about engineering works, technical drawing is its backbone. But for crypto, candlesticks are one of the principal instruments used to minimize trading loss.
Learning to become a trader might be challenging. Especially in the situation where there are many different ways, methods, and strategies. The most popular way used by traders to look for trading opportunities is by observing the candlestick patterns. What then are Candlesticks and their patterns? This article aims to shed light on those questions that have been burdening your mind for a long.
What are Candlesticks?
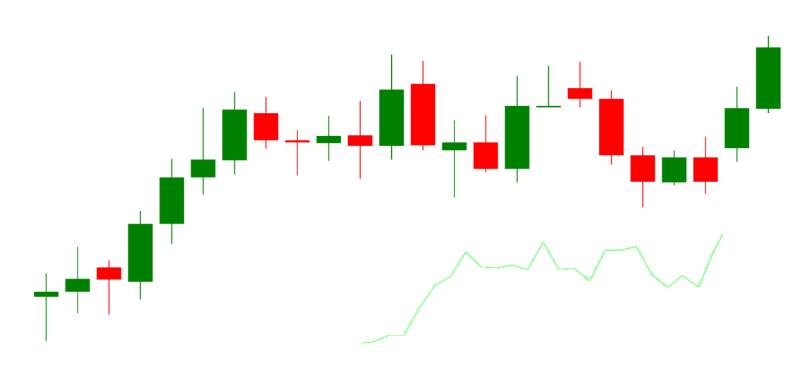
Candlesticks display information about an asset’s price movement. These charts enable predictions of possible outcomes in a market. A candlestick shows price movement per day. It means if you have 20 trading days in a month, 20 candlesticks will show the price movement for the month.
Candlesticks show four points of price action, namely open, close, high, and low point, depending on the trader’s duration. Many algorithms have the same price information shown in candlestick charts. It is worthwhile to say that emotions influence trading largely, which is why using candlestick charts is important.
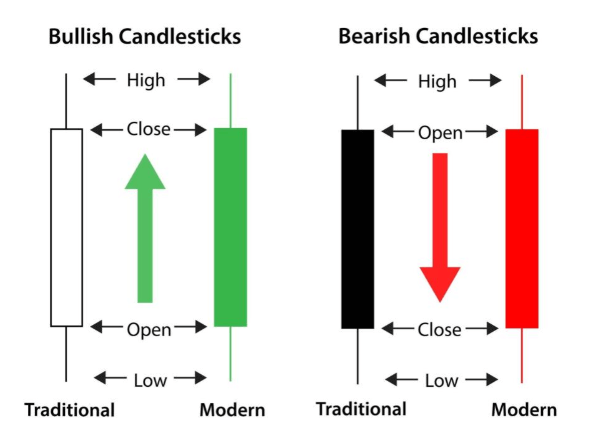
There are two types of candlesticks, bullish and bearish. Bullish candlesticks can be green or white, while bearish candlesticks are reddish or black.
Left (Red) — Bearish candlesticks
Sponsored
Right (Green) — Bullish candlesticks
The structure of a candlestick is such that it consists of a rectangle called the real body. The high and low points are represented by a vertical line projecting from the real body’s top and bottom. They are called the shadow or wick.
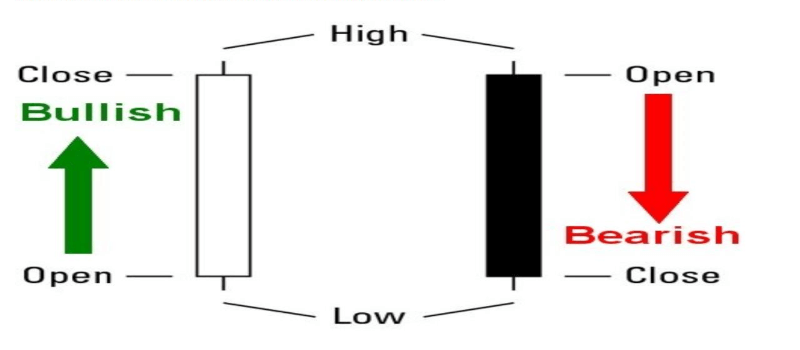
- Open: This is the point where the trading session opened. For a bullish candle, the open point is at the bottom of the body, while that of a bearish candle is at the top.
- Close: This is the point where the trading session closed. While the close point for a bullish candle is at the top of the body, the bearish candle has its close point below the body.
- High: This is where the market reached its highest price during the trading session. It gives you an image of how high the market moved in one trading period.
- Low: This is where the market reached its lowest price during the trading session. It also gives you a picture of how low the market moved in one trading period
How do you read a Candlesticks?
If the upper wick on a down candle is short, it indicates that the current day’s opening was near the high of the previous day. A short upper shadow on an up day dictates that the close was near the high. The relationship between the days’ price points, i.e, open, high, low, and close, determines how the daily candlestick’s look.
Patterns are either bullish and bearish. Bullish patterns show that the price is likely to rise, while bearish patterns show that the price is likely to fall. No pattern works all the time, as candlestick patterns represent tendencies in price movement, not guarantees
Candlesticks Pattern
Several charts help traders find trading opportunities to know what step they should take next and when to take it. These charts include; Line charts, OHLC charts, Candlestick charts, Bar charts, Point and Figure charts, etc.
They are used mainly in reading and predicting the market. But they seemed to have priority over one another. Before you start trading, it’s important to familiarise yourself with the basics of candlestick patterns and how they can affect your decisions. This article decided to guide you through the most commonly used and effective chart for trading, the Candlesticks Pattern Charts.
Candlestick charts are a technical trading tool that packs data for multiple time frames into single price bars. This gives them priority over all other Trading charts. Summarily, traders use candlestick charts to determine possible price movements based on previous patterns.
The Top 12 Candlesticks Pattern Cheat Sheet
Since candlesticks are numerous, memorizing and identifying each of them could be cumbersome for a trader. Candlestick patterns, which are technical trading tools, have been used for centuries to determine future price direction. It shows how important they are for a profitable trade in the market.
There are some candlesticks you need to know to make a profit. By following them you will get the basic price-action structure of the 12 most effective patterns as listed below.
Bullish candlesticks
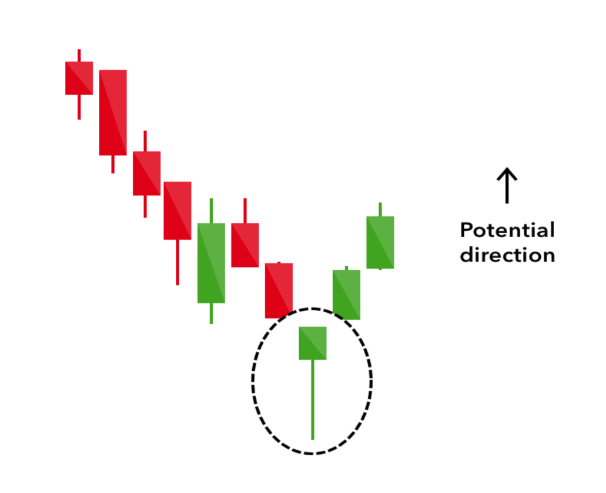
1) The hammer candlestick pattern
As the name implies, it looks closely like a hammer. It consists of a short body with a long wick below the body. It is usually at the bottom of a downward trend. A hammer candlestick indicates that even though there were selling pressures during the day, at a point in time, an intense buying pressure reverses the price.
2) Inverse Hammer Candlestick Pattern
A similar bullish pattern is the inverted hammer candlestick. The only difference between the hammer candlestick and the inverted hammer candlestick is that the upper wick is longer than the lower wick. It indicates a buying pressure, followed by a selling pressure that was not strong enough to drive the market price down. The inverse hammer dictates that buyers will soon take control of the market.
3) Engulfing Candlestick Pattern
The bullish engulfing pattern is two candle reversal patterns formed at the end of a downtrend or an uptrend. The first candle is a short red body that is engulfed by a larger green candle. Even though the second day opens lower than the first, the bullish market pushes the price up, resulting in the buyers’ success
4) Piercing Candlestick Pattern
The Piercing Pattern is a two candle reversal pattern made up of a long red candle, followed by a long green candle. The two-stick pattern indicates strong buying pressure, the price rises above the mid-price of the previous day.
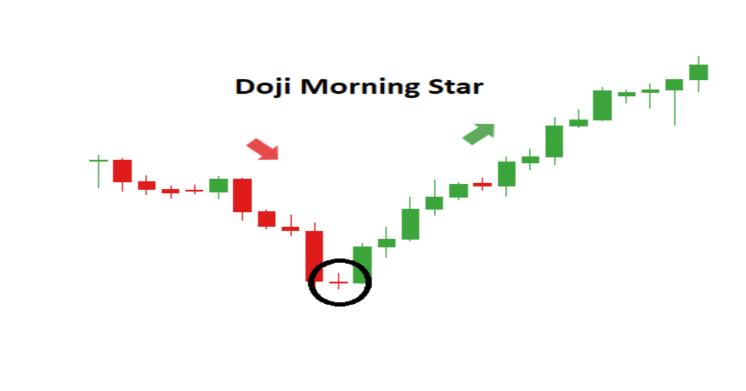
5) Morning Star Candlestick Pattern
The morning star candlestick pattern is a sign of hope in a bleak market downtrend. It is a three-stick pattern: one short-bodied candle between a long red and a long green. It signals that the first day’s selling pressure is reducing, and a bull market is on the way. Traditionally, the ‘star’ will have no overlap with the longer bodies, as the market separates both on open and close.

Bearish candlesticks
6) Hanging Man Candlestick Patterns
The hanging man is the bearish equal of a bullish hammer candlestick. It has the same shape but is at the end of an uptrend. It indicates a significant sell-off during the day, but that buyers could push the price up again. The high sell-off is an indication that the bulls are losing control of the market.
7) Shooting Star Candlestick Patterns
The shooting star is the same shape as the inverted hammer. You can find it at the top of an uptrend: it has a small lower body and a long upper wick. Usually, the market will deviate slightly higher on opening and rally to an intra-day high before closing at a price just above the open – like a star falling to the ground.
8) Bearish Engulfing Pattern
A bearish engulfing pattern takes position at the end of an uptrend. The first candle has a slight green body that is engulfed by the next long red candle. It signifies a peak or slowdown of price movement. It is also a sign that the market downturn is imminent. The significance of the trend depends on the second candle’s length (how lower it is).
9) Evening Star Candlestick Pattern
The evening star is a three-candlestick pattern that is the equivalent to the bullish morning star. It is a short candle staying between a long green candle and a large red candlestick. It shows the reversal of an uptrend and is particularly strong when the third candlestick wipes the first candle’s gains.
10) Three Black Crows Candlestick Pattern
The three black crows candlestick pattern comprises three consecutive long red candles with short or non-existent wicks. Each session opens at a similar price to the previous day, but selling pressures push the price lower and lower with each close. Traders interpret this pattern as the start of a bearish downtrend, as the sellers have overtaken the buyers during three successive trading days.
Two Continous candlesticks
11) Doji Candlestick Pattern
The Doji Candlestick pattern resembles a cross or plus sign, and it from a single candle. Alone a Doji is a neutral signal, and it represents the equilibrium between demand and supply. This pattern’s appearance indicates a tug of war in which neither the bulls nor the bears are winning.
12) Spinning Top Candlestick Pattern
The spinning top candlestick pattern has a short body centered between wicks of equal length. The pattern indicates indecision in the market, resulting in no meaningful change in price. The bulls set the price higher, while the bears pushed it low again. Spinning tops signify periods of consolidation, following a significant uptrend or downtrend.
Bottomline
Knowing the candlestick patterns to follow for different trades is essential. The above candlestick pattern cheatsheet guides you on the different patterns that exist, their importance, and when you need each of them. Each trading day presents Forex traders with enormous opportunities. But only intelligent traders leverage these opportunities. We hope this guide will help you on your trading journey.
