
- The short-term outlook for Bitcoin shows resistance levels and potential retracements.
- Weak market structure raises concerns for a potential breakdown.
- Market analysis highlights key points to watch for in the near future of Bitcoin.
Bitcoin has had a great start to 2023, from starting at $16,000 and surging back above $21,000 in January to greeting February with a brief visit above $24,000. Is the positive trend set to continue?
The price of Bitcoin has fluctuated around the $23,000 level since the beginning of the month, currently serving as a temporary base with multiple support and resistance levels. The cryptocurrency market is highly volatile and prices can deviate significantly from these levels. Thus, this analysis should only be viewed as a guideline rather than a definite prediction.
Short Term Outlook
The price of Bitcoin has faced strong resistance at an upward-sloping line for the past two weeks. Every time the price has approached this line, it has faced significant rejection and dropped, indicating strong selling pressure in that price range, making it challenging for the price to increase.
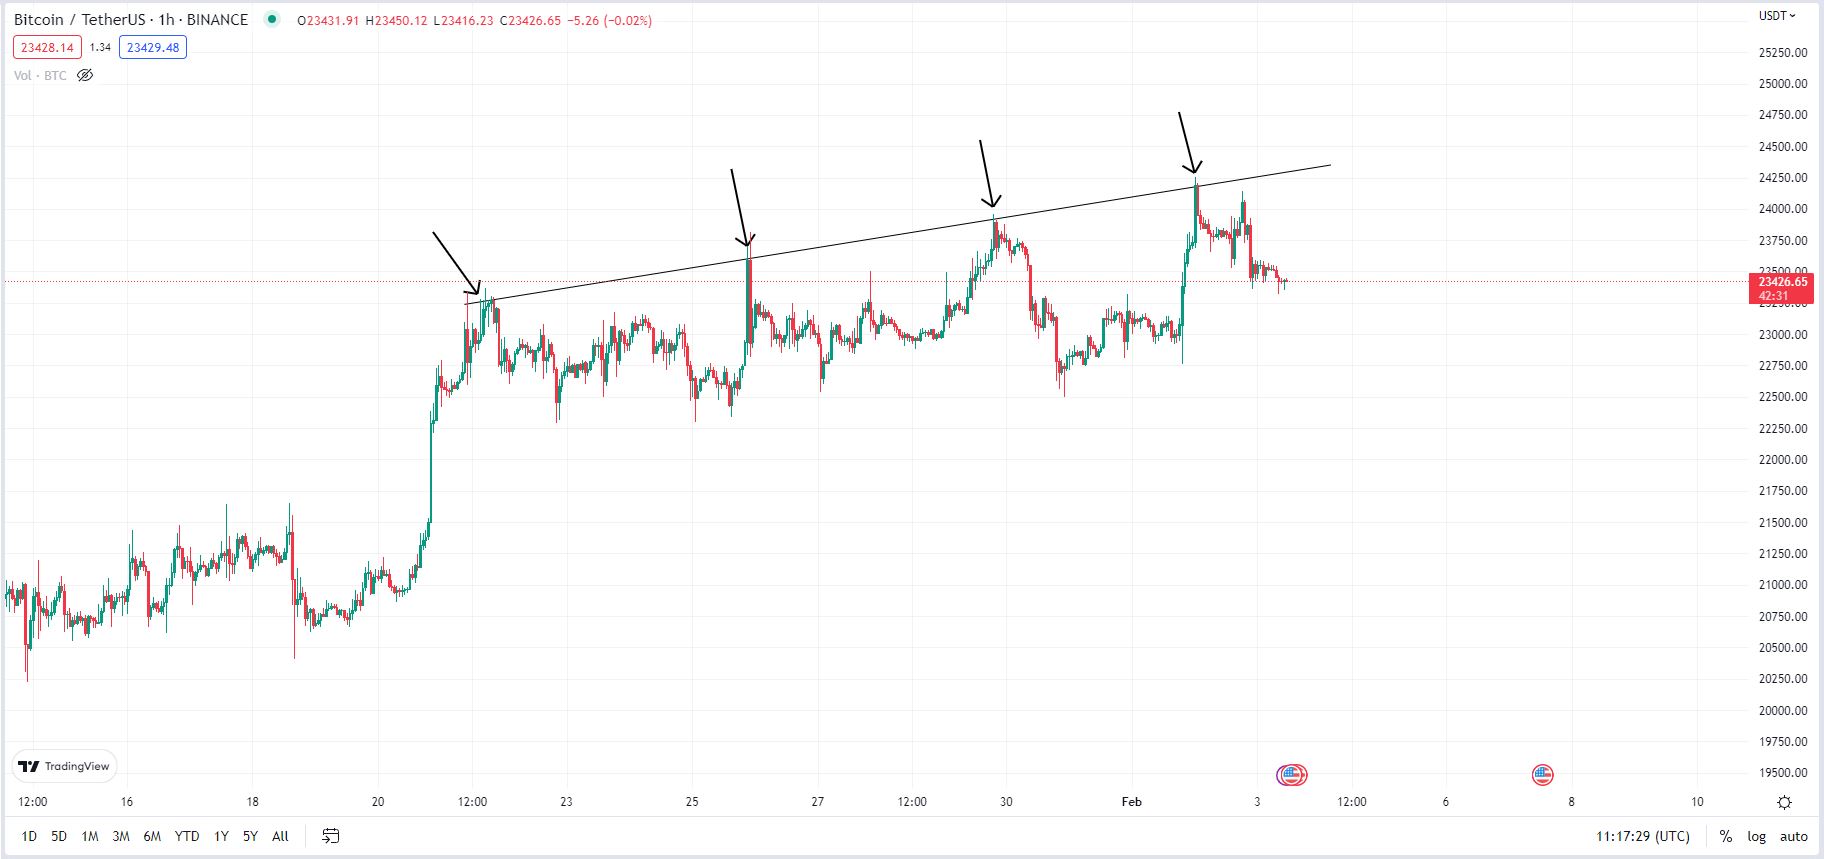
Upward Sloping Resistance forming on the One-Hour price chart for Bitcoin. Source: TradingView.
While there is resistance above, there are also support levels below that play an important role in analyzing the price of Bitcoin. Unlike resistance levels, which represent strong selling pressure, support levels indicate stronger buying pressure and are typically areas where the price is more likely to hold steady.
Currently, there is a crucial support level at $23,300, previously a resistance level breached on February 1st, 2023. This support level will likely act as a barrier against further downward movement.
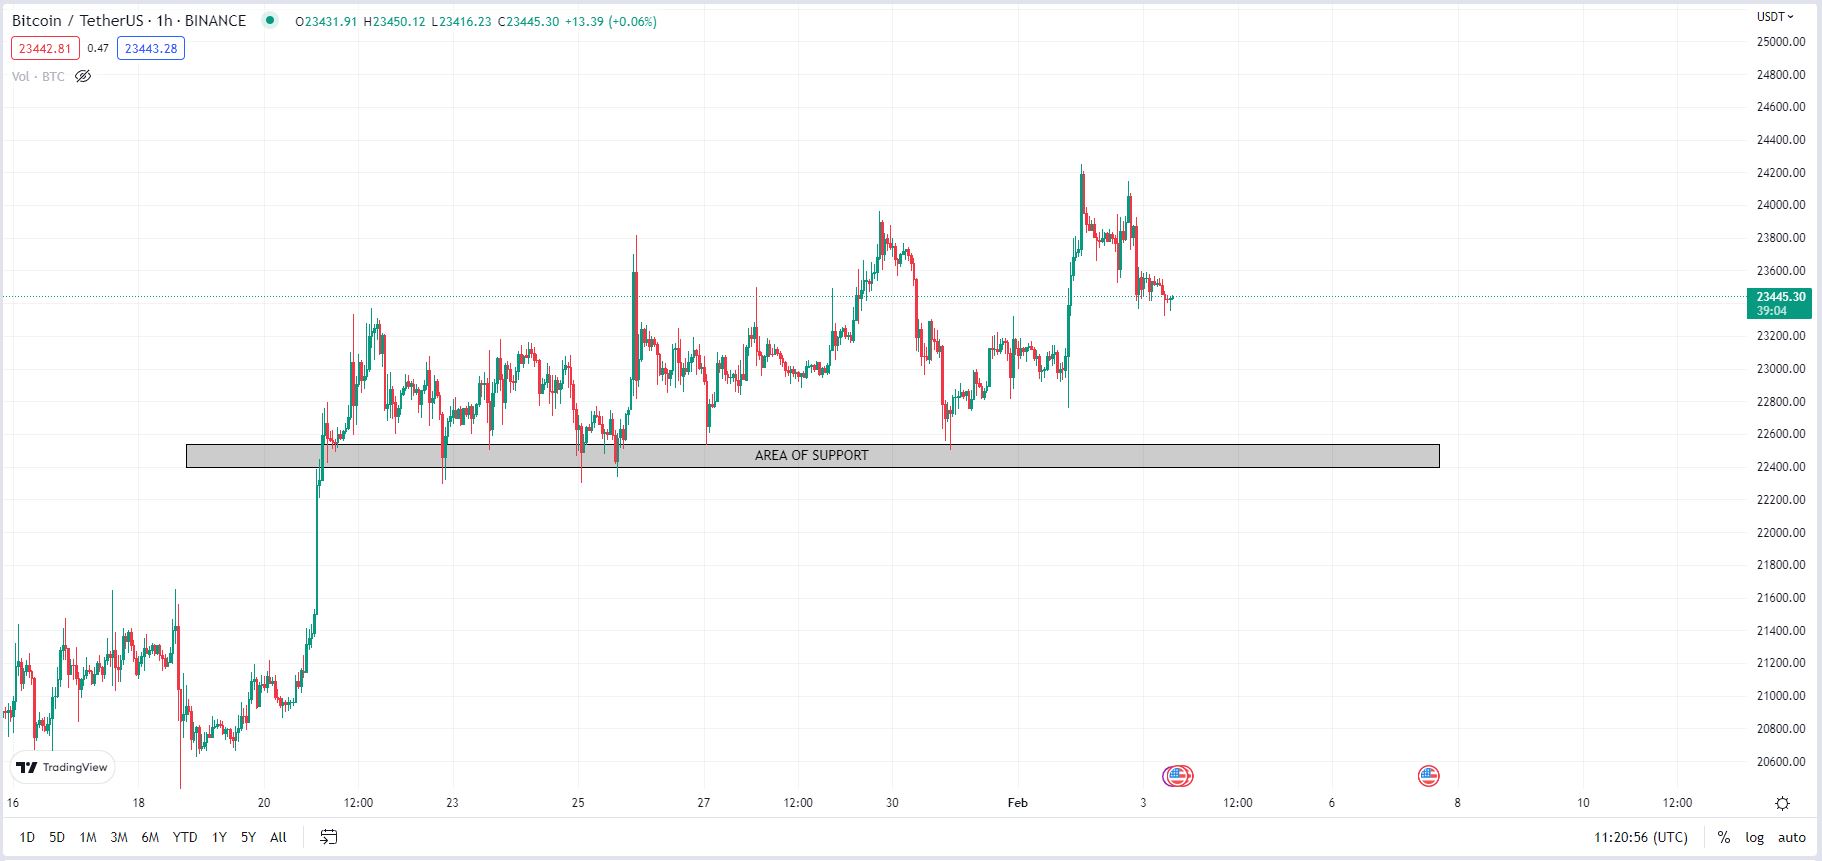
Area of Support forming on the One-Hour price chart for Bitcoin. Source: TradingView.
Medium Term Outlook
The four-hour time frame offers a complete picture of the market trend. Currently, a rising wedge pattern is being formed, this is considered a bearish reversal pattern. This pattern is formed after a significant upward movement and indicates a potential for a downward trend.
If the price does break below the upward-sloping support line, the likely breakdown target would be back to the previous support at $21,000 to $21,300. Based on historical data, this particular pattern has an 81% chance of breaking bearish.
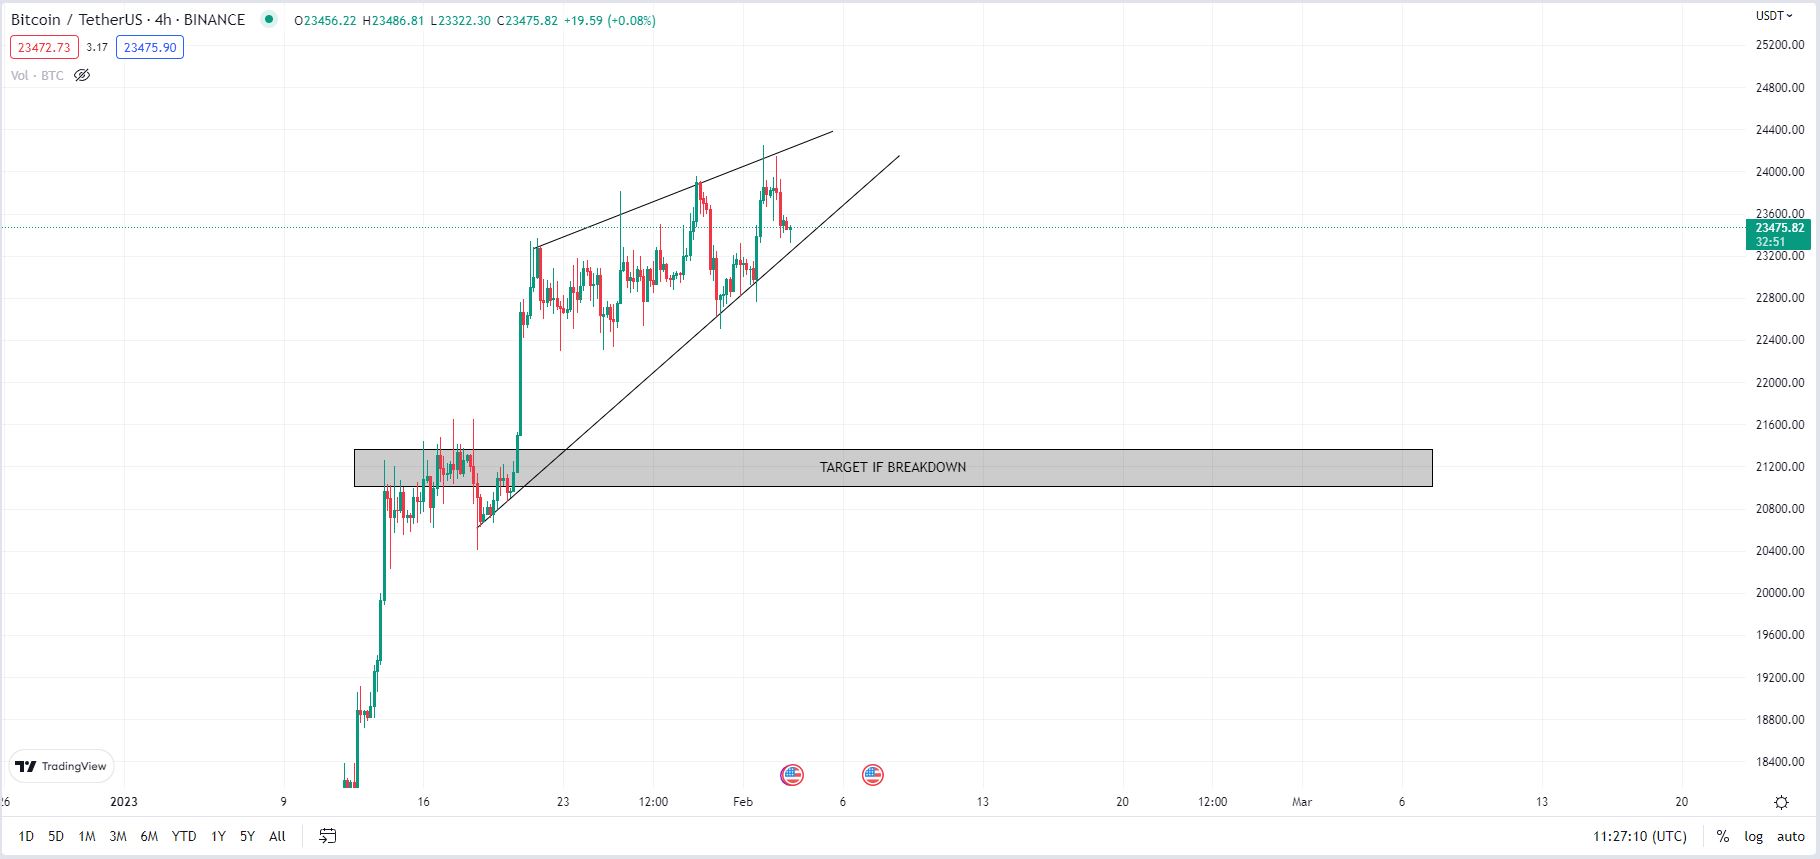
Rising Wedge Pattern forming on the Four-Hour price chart for Bitcoin. Source: TradingView.
The Relative Strength Index (RSI), which is a tool used to gauge the strength of the price action, shows that the momentum behind Bitcoin’s price action is diminishing as the highs generated by the asset are becoming less intense each time.
This has resulted in a pattern that appears to have a rounding top. When the price action creates higher highs while the RSI creates lower highs, a bearish divergence is created, indicating a potential trend reversal in the market.
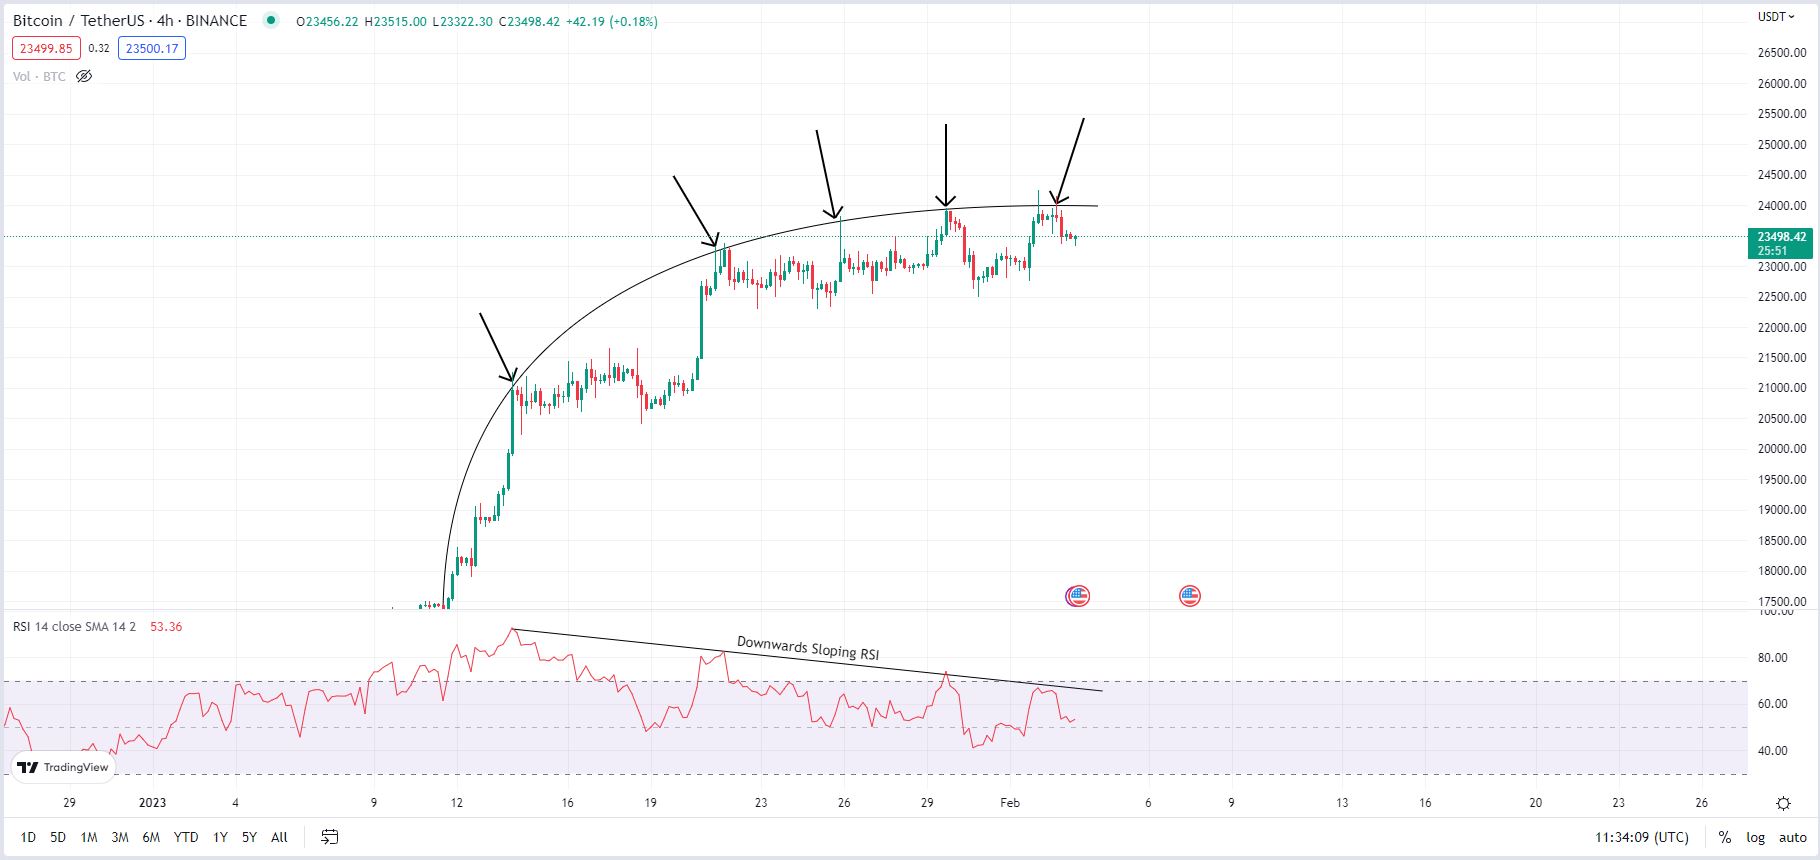
Rounding Top forming on the Four-Hour price chart for Bitcoin. Source: TradingView.
The four-hour chart also reveals a parallel channel pattern, with Bitcoin’s price rapidly increasing and then leveling off. If the price does not decline due to the current market’s uncertain conditions and stays steady, it would be considered a positive indicator for Bitcoin, as it suggests that the price is not likely to decrease further.
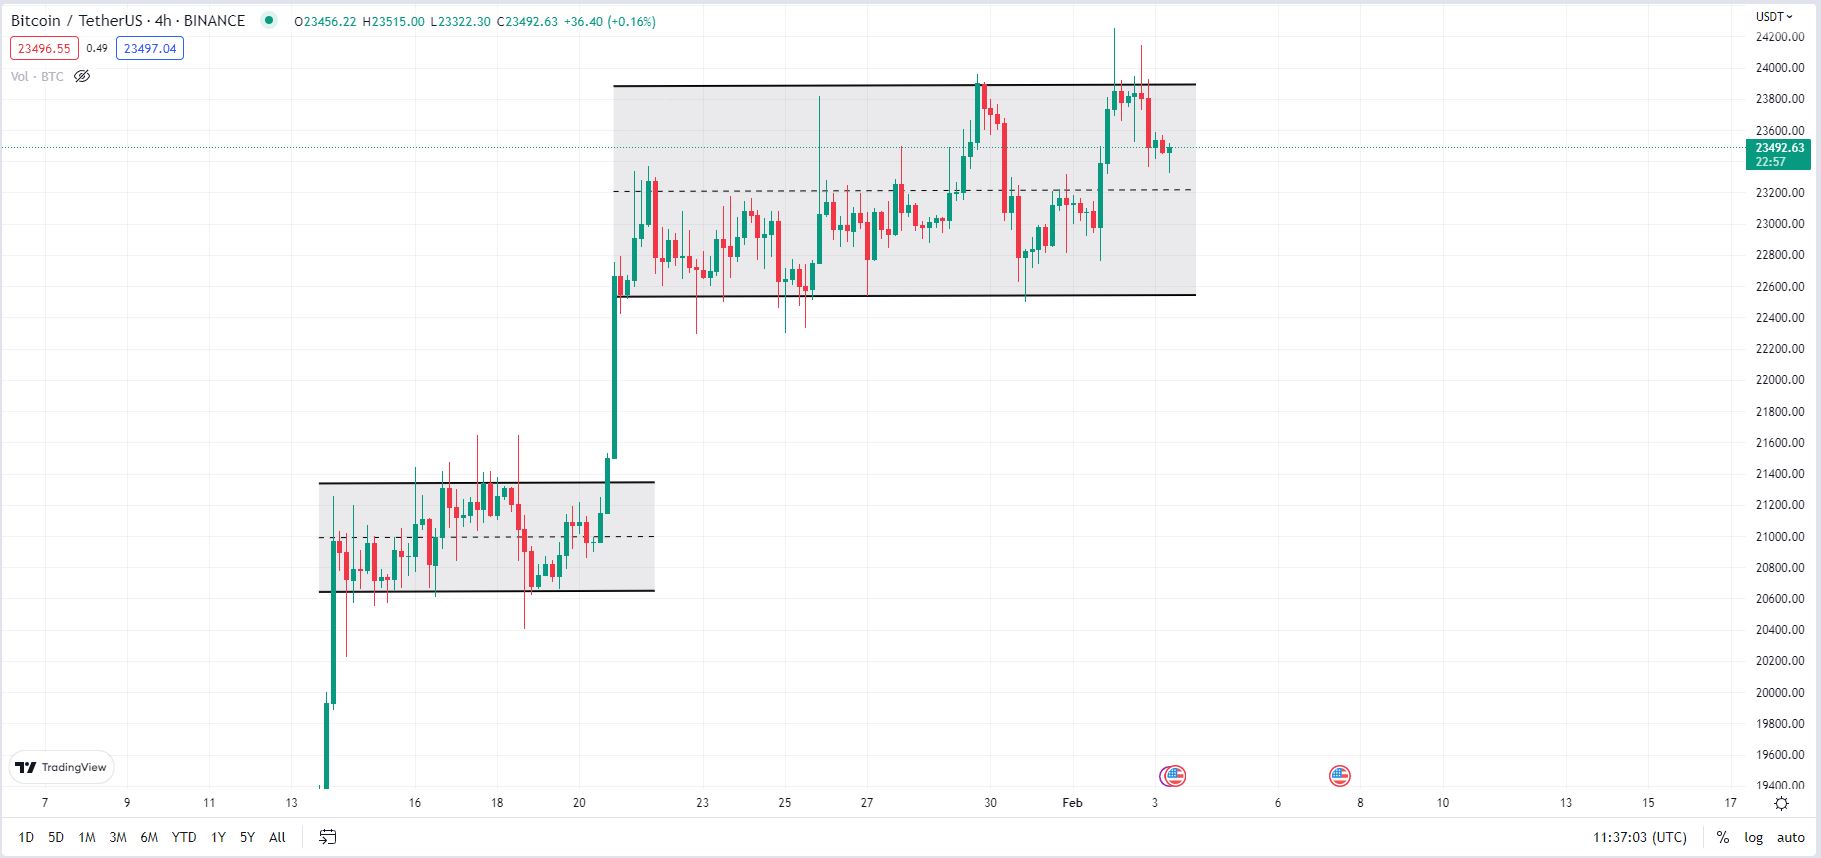
Parallel Channel forming on the Four-Hour price chart for Bitcoin. Source: TradingView.
Long Term Outlook
On the daily time frame, there is a sloping resistance line being formed, this line already has many rejections. Unless Bitcoin breaks above this line, it will be necessary to watch as it gives credibility to the idea of the retracement to $21,000.
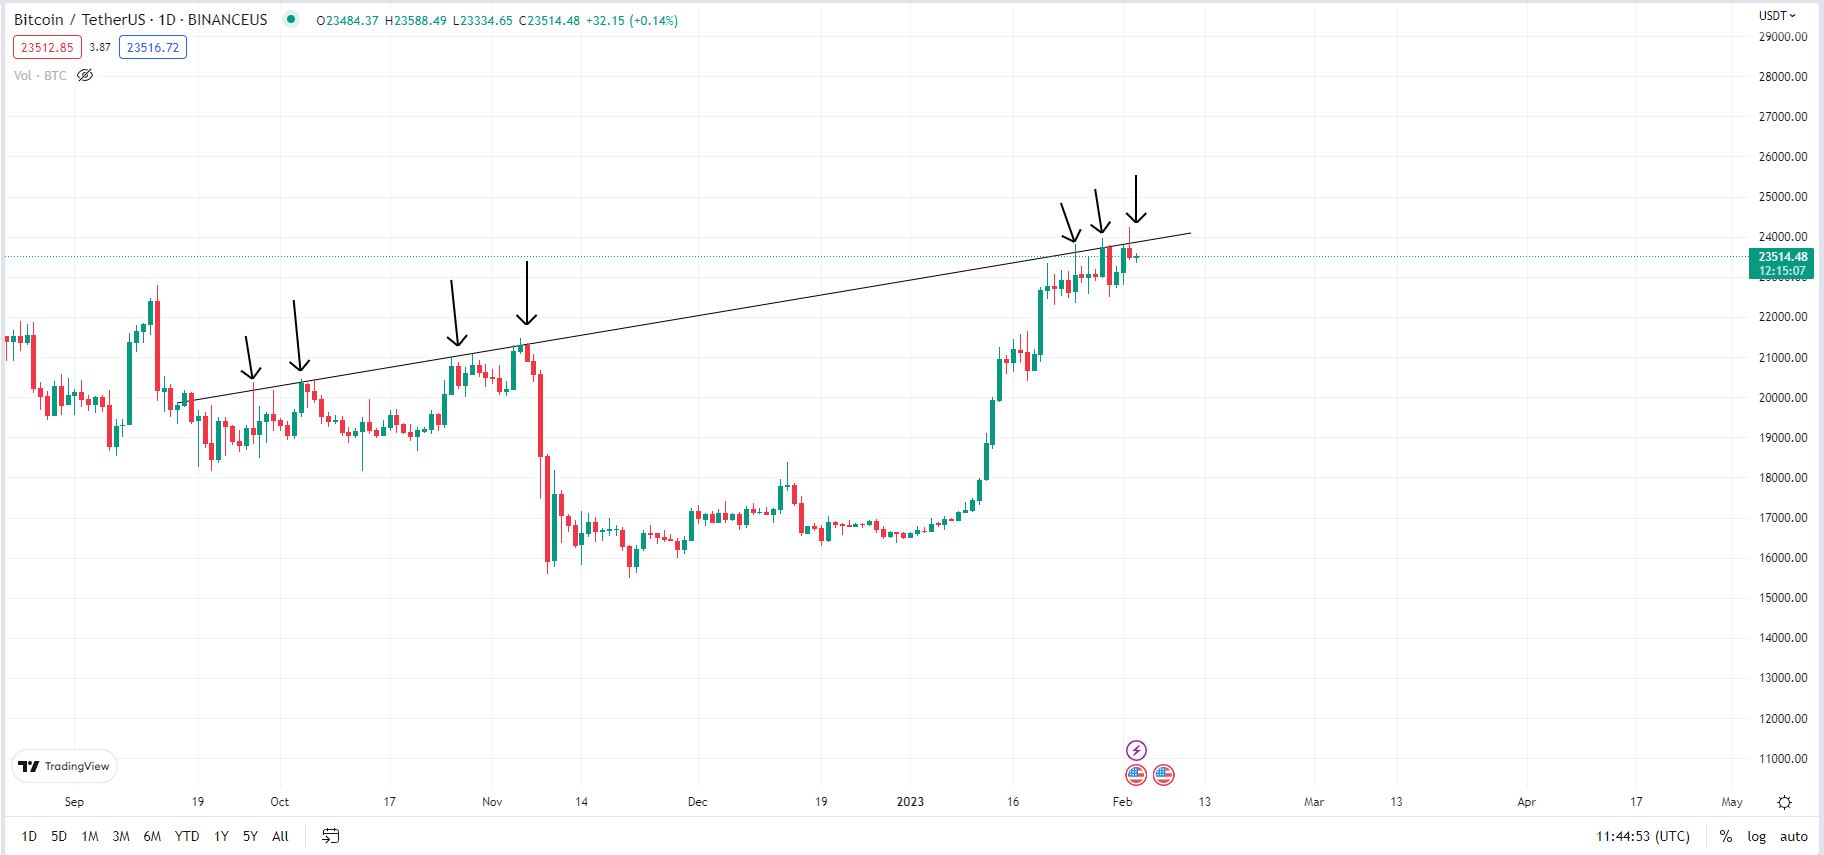
One-Day price chart for Bitcoin. Source: TradingView.
The weekly time frame for Bitcoin is showing a significant event for the long-term outlook. The Bitcoin exponential moving averages (EMA) ribbon, a visual representation of multiple exponential moving averages plotted on the chart, is creeping towards a potential bullish cross. This bullish cross means that a shorter-term EMA is crossing above a longer-term EMA, indicating a potential shift from bearish to bullish momentum in the market.
Although this indicator is slightly delayed compared to the price action, the fact that this is occurring for the first time in 1,000 days further emphasizes the significance of this event for the long-term outlook of Bitcoin. On the three-day timeframe, this EMA flip has already begun.
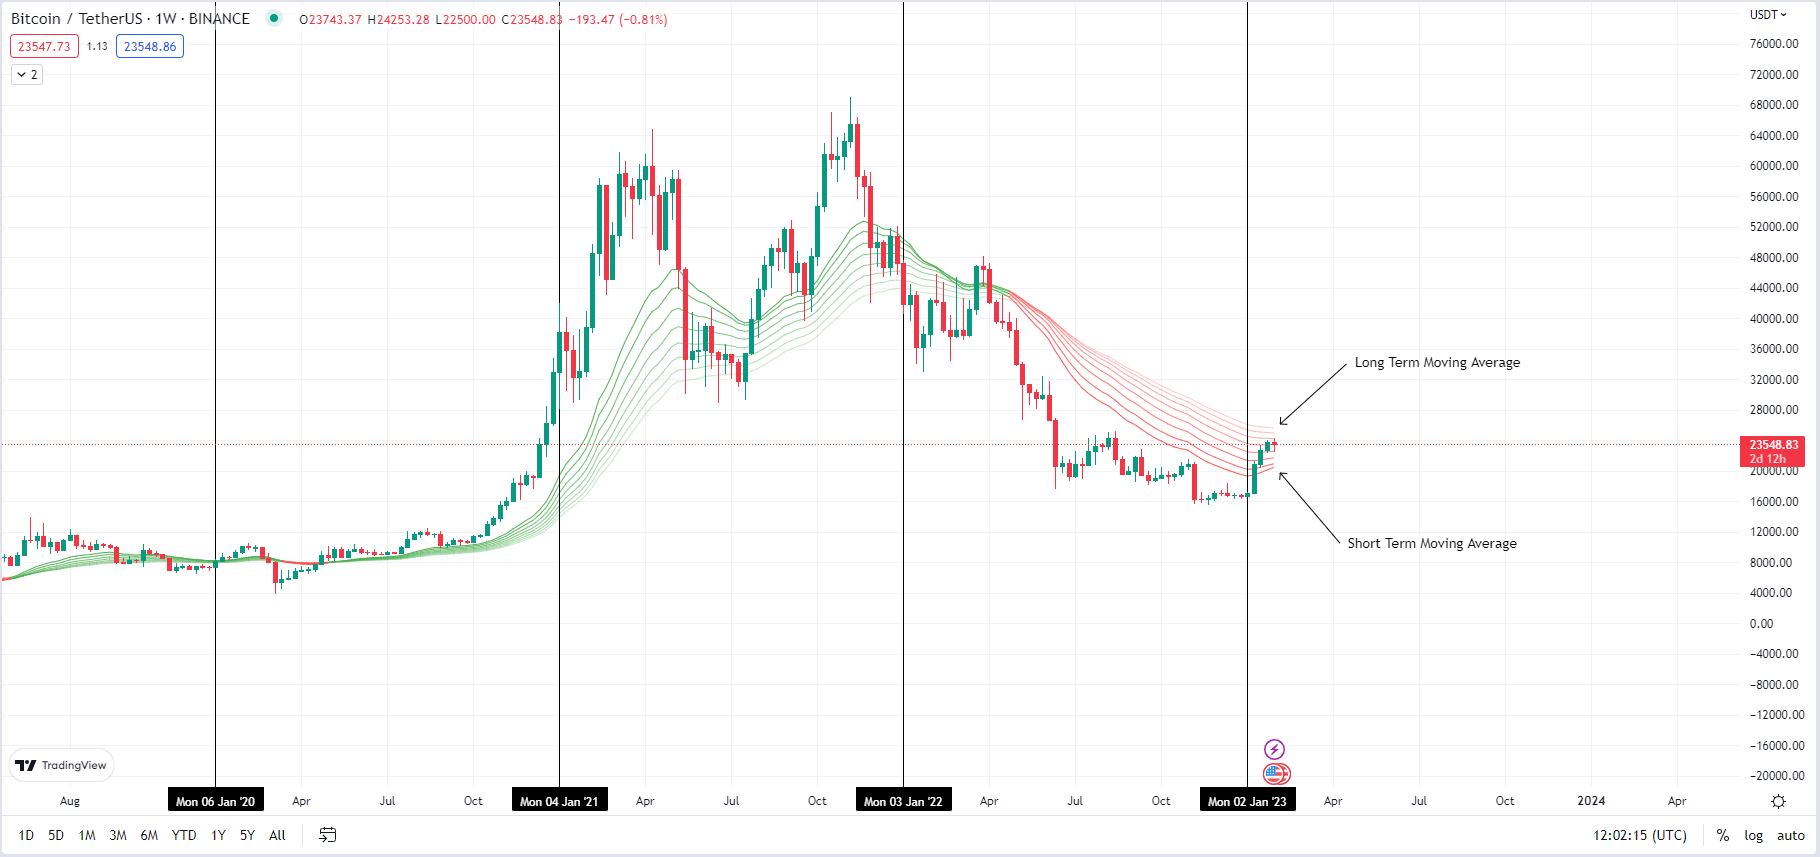
One-Week price chart for Bitcoin. Source: TradingView
On the Flipside
- Despite the signals presented by the chart, it is important to know that unexpected events could disrupt the market and change the current outlook.
- It is possible that even if technical indicators are bullish or bearish, opposing market sentiment could lead to an unpredicted outcome.
- While technical analysis can help predict future price movements, there are many alternative ways to interpret the same chart, which could provide a different outlook.
Why You Should Care
As Bitcoin continues to make headlines for its price movements and potential to revolutionize the financial industry through blockchain technology, understanding current market conditions and critical indicators can greatly impact future developments.
For more about the Bitcoin price action:
Bitcoin (BTC) Continues Strong Start to 2023, Hits $23k, Analysts Divided on Rally
Read about the previous Bitcoin rally below:
What’s Next for Bitcoin as Bears Hibernate? – DailyCoin
