- Over the past few days, both Bitcoin and Ethereum have seen a significant price increase.
- Ethereum is currently displaying a bullish bias from a technical perspective.
- Both Bitcoin and Ethereum face potential downside risks.
Bitcoin and Ethereum are making some serious waves, and the charts seem to tell a story. Since Monday, February 13th, BTC and ETH have seen a significant price increase, with Bitcoin flying toward the $25,000 mark and Ethereum briefly surging above $1,700 on Wednesday, the 15th. What’s next for these digital assets? Will the bullish trend continue, or will a correction be expected soon?
Bitcoin Price Technical Analysis
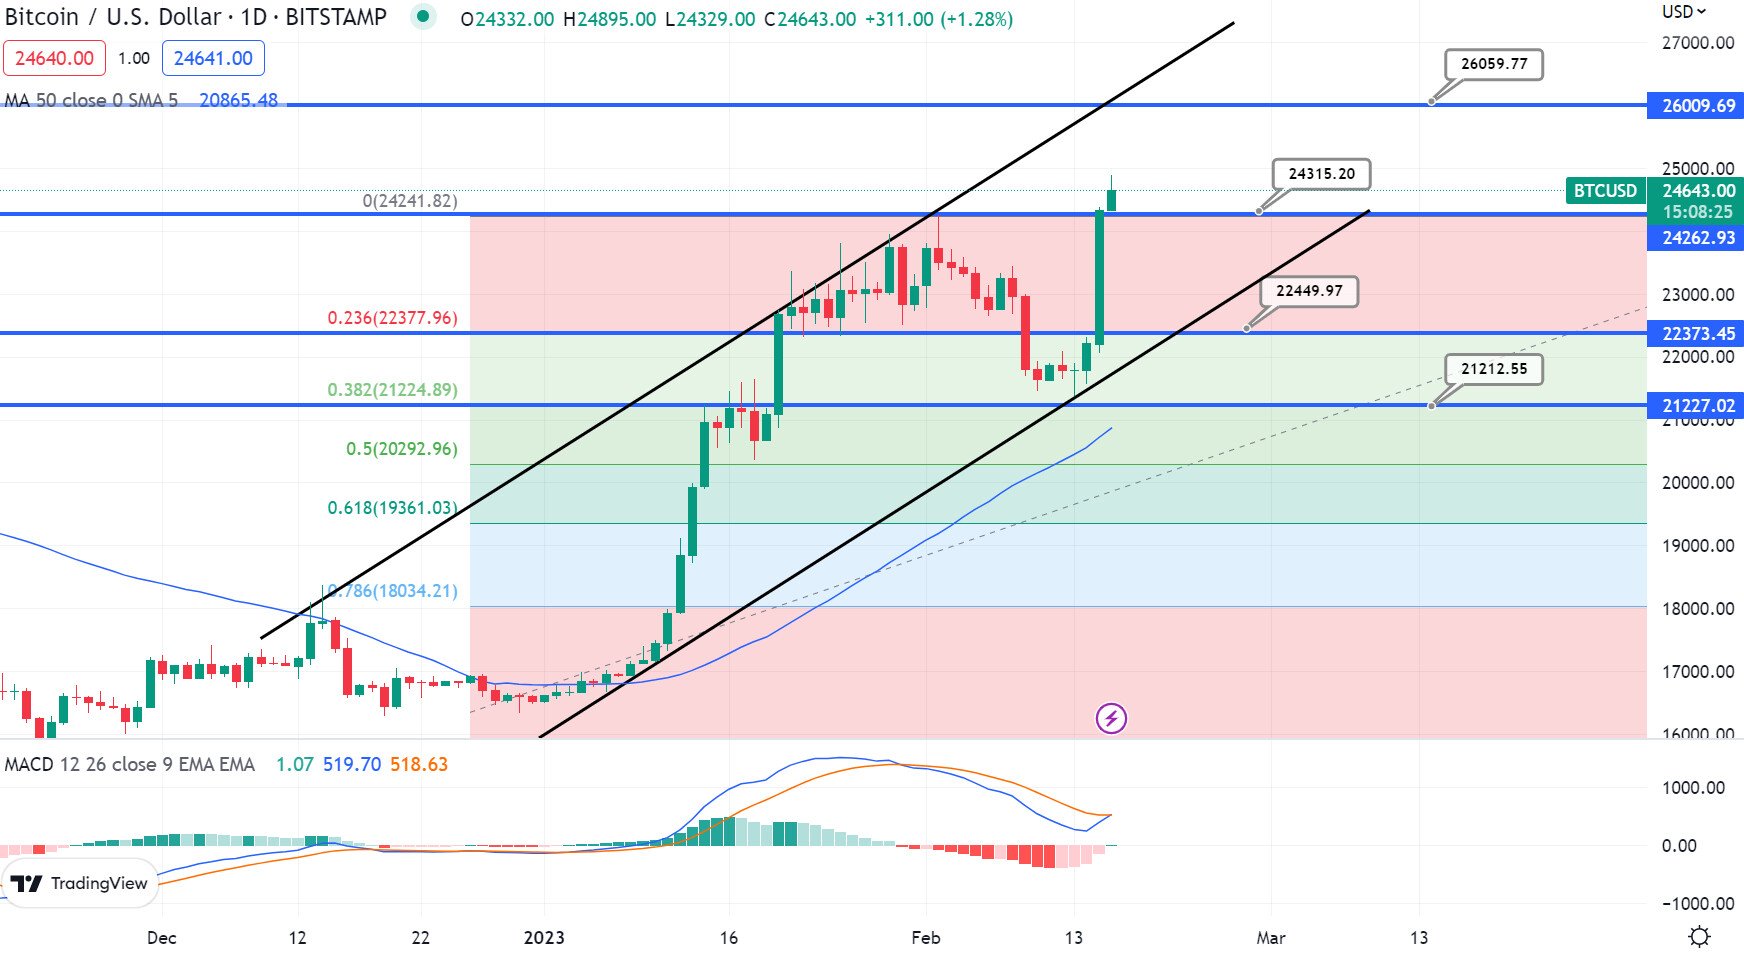
Bitcoin’s price has been showing strength recently, climbing nearly 10% over the past 24 hours to its current price of $24,640 at the time of writing. The leading digital asset successfully surged above the key resistance level of $22,000 and remained well above the 200-day simple moving average. The price briefly spiked into the $25,000 resistance zone, surpassing the last swing high at $24,246.

Bitcoin Daily Price Chart. Source: Tradingview
This zone was heavily contested as the bears emerged to defend their territory. These traders will hope to ensure that the price doesn’t exceed the $25,000 level. In the event Bitcoin does break $25,000, there the price momentum may see it push the $26,200 level and perhaps even $27,000.
Although the bears may have defended the $25,000 zone, the bulls have support levels to count on, one of which is located near the $24,250 mark. The main breakdown support is situated in the $23,250 zone. Assuming the price closes below the $23,250 level, it could prompt another decline in the coming days. The $22,500 and $21,400 support levels could be revisited in this scenario.
Ethereum
Cryptocurrencies typically move in the same direction, so it is not surprising that Ethereum also demonstrated an increase in value. While Bitcoin gained around 10%, Ethereum experienced a similar surge of almost 9%. At the time of writing, Ethereum holds a value of $1,680 but could need to see some sort of catalyst to continue higher.
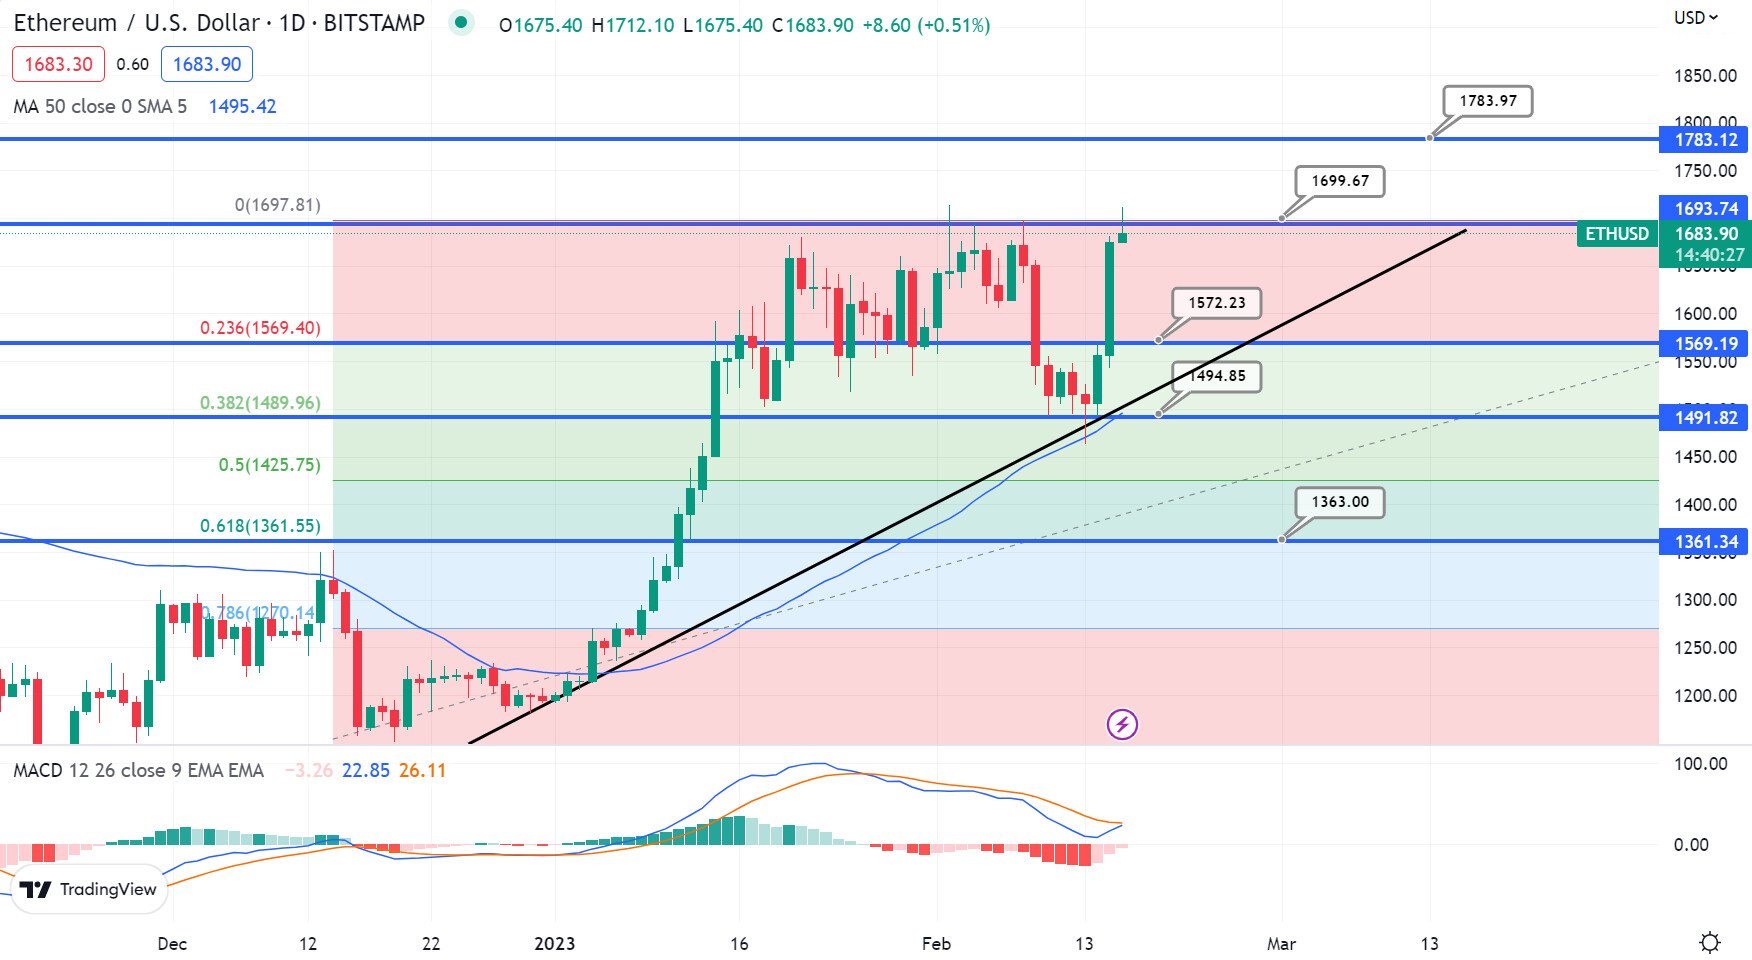
From a technical perspective, the ETH chart appears to display a bullish bias. It upwardly bounced off the $1,490 level, a significant support mark at the 38.2% Fibonacci retracement level. A Fibonacci retracement level is a technical analysis tool used to identify potential support and resistance levels in a market trend.
Sponsored
This is based on the idea that markets often retrace a predictable portion of a move, after which they continue to move in the original direction. A bullish breakout above the double-top resistance level of $1,700 could propel the ETH price to $1,785.

Ethereum Daily Price Chart. Source: Tradingview
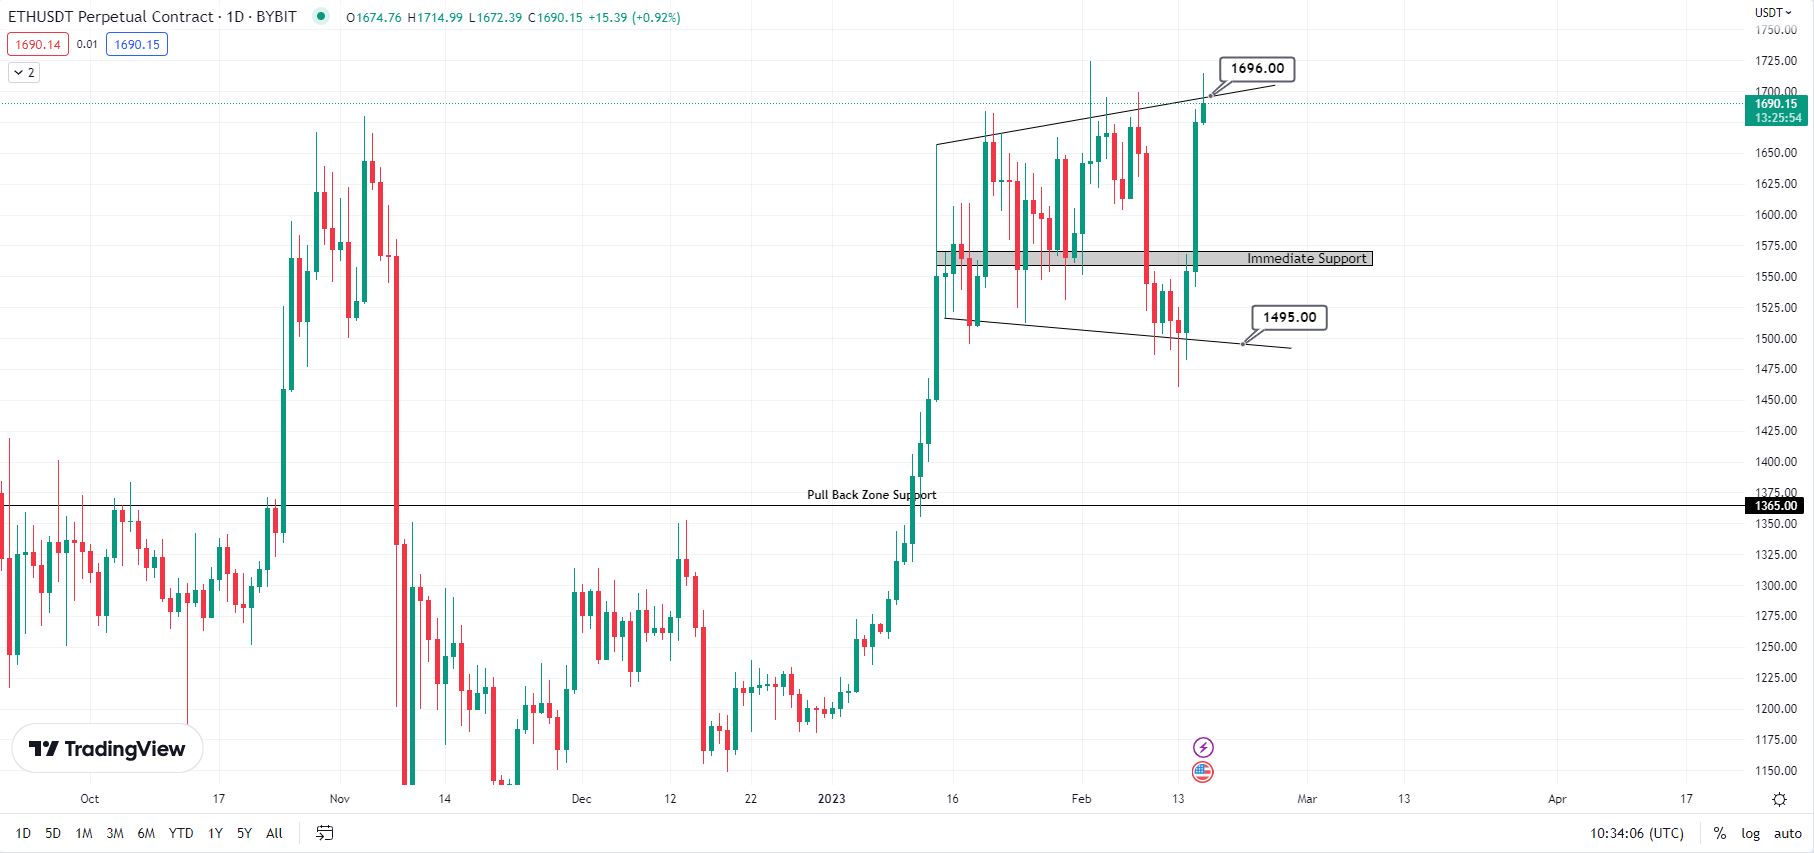
Further upward momentum could result in the price climbing toward $1,890. However, while the increase of nearly 9% is a strong upwards move, the coin is still trading within an expanding triangle formation, which presents significant resistance above.

Ethereum Daily Price Chart. Source: Tradingview
If Ethereum faces rejection at the upward-sloping resistance line of $1,700, it could seek support at the $1,575 area as a potential rebound point. However, if this level is broken, it could increase selling pressure, causing the price to drop to $1,495 or even $1,365.
On the Flipside
- The market can be unpredictable, and the signals presented by the charts are frequently disrupted, changing the sector’s outlook.
- Technical indicators are not always a guaranteed signal for future price movements, as opposing market sentiment could lead to an unpredicted outcome.
- While technical analysis is a standard method for predicting price movements, all charts have multiple interpretations. DailyCoin does not provide financial advice. Due diligence and research are always encouraged.
Why You Should Care
Bitcoin and Ethereum are leaders in the crypto market. As such, their movements often define the overall direction of the sector and should be monitored closely.
To get caught up with the Bitcoin price action, read here:
Bitcoin: What to Expect in the Short and Long Term
If you are wondering how the Ethereum price arrived here, read this:
Is Ethereum Set to Rally Despite February’s Slow Start?
