- Ethereum has experienced a slow February so far after its January rally.
- 20-day EMA and RSI indicators display mixed results.
- Could ETH experience a rally to reach $1,800 or a decline to $1,500?
Ethereum (ETH) appears to be experiencing a break in extreme price action in February after a strong rally in January. Vertical rallies, which refer to rapid price increases often accompanied by high trading volume, are not typically sustainable; slowing down after a pump is generally seen as a positive sign, giving the market a chance to breathe. The question remains, will ETH continue its upward momentum while Bitcoin stabilizes in the short term?
Examination of the ETH Chart
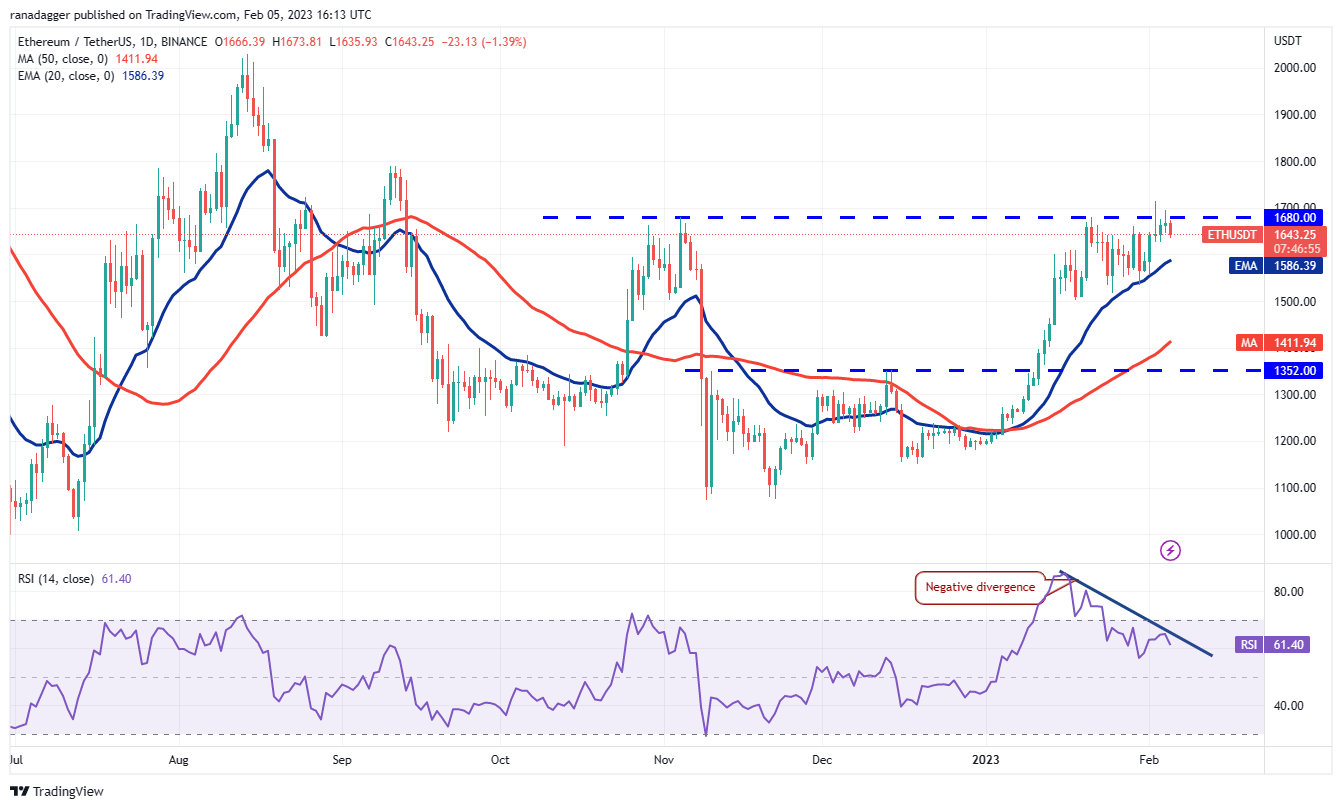
Currently, ETH is trading close to the $1,680 resistance level. Resistances are usually a level at which it is difficult for the price to rise above. However, tight consolidation near resistances has a higher likeliness of resolving upward.

Ethereum Daily Chart. Source: TradingView
The upward slope of the 20-day exponential moving average (EMA), a widely used technical indicator that averages prices over a set period, which stands at $1,586 at the time of writing, favors buyers. However, the negative divergence on the relative strength index (RSI), a momentum oscillator that compares the magnitude of recent gains to recent losses, indicates that the bulls may be losing their grip on the asset. For the bulls to maintain control, they need to drive the price above $1,680.
Possible Outcomes for the ETH Price
If the bulls accomplish this, the price of ETH could rally to $1,800, which will be tested as resistance. Should the price hold out above the newly acquired support at $1,680, the rally would have a higher likelihood of continuing to $2,000.
On the other hand, if the price drops below the 20-day EMA, the leading altcoin’s price may tumble to $1,500, which represents a crucial support level or a price level at which it is expected to find strong buying interest. If the $1,500 support is broken, the price could drop even further to $1,352.

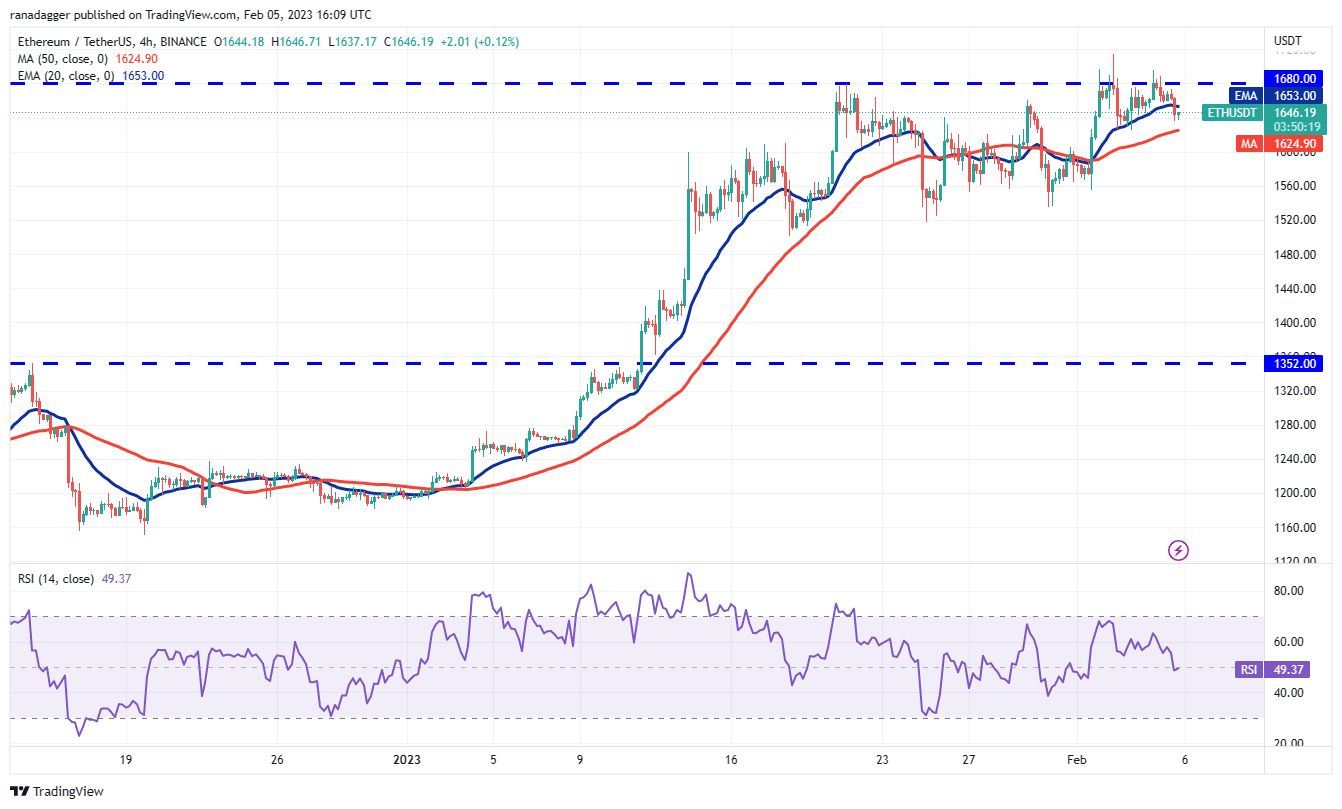
Ethereum Four-Hour Chart. Source: TradingView
On the four-hour chart, the bears have pushed the price below the 20-EMA, which may signal a potential retreat for the bulls. There is limited support at the 50-simple moving average (SMA), which is calculated by summing the closing price of an asset over the last 50 periods and dividing by 50.
Sponsored
If this does not hold, the price could drop to $1,500. However, an upward price turn from the moving average would enable the bulls to make another attempt to drive the price above the overhead resistance. In this case, the uptrend would most likely resume.
A Quick Look into Bitcoin
Bitcoin has experienced a correction in recent days after reaching a high of $24,255 on February 2nd. The price is currently near a strong support zone between $22,800 and $22,292, including the 20-day exponential moving average ($22,436). If the price rises from this support zone, the bulls may try to push the price up toward $25,000.
If the support zone fails to hold, the price may experience a deeper pullback and fall to $21,480 or even $19,572. The four-hour chart shows a bearish divergence on the RSI, suggesting the bullish momentum may be weakening, but a rebound off the support line of the channel could lead to the resumption of the uptrend.
On the Flipside
- Unexpected events could potentially disrupt the market and alter the current outlook.
- Market sentiment could override technical indicators and lead to an unpredictable outcome.
- Technical analysis may provide insight into future price movements, but multiple interpretations of the same chart could offer a different outlook.
Why You Should Care
Ethereum, being one of the largest and most influential cryptocurrencies, can significantly impact the market with its price movements. Any major change in ETH’s trajectory could serve as a leading indicator for the rest of the market.
If you are wondering how the Ethereum price got here read this:
Ethereum (ETH) Spikes 7% to Close in on $1,700, but All Eyes Are on the $2,000 Mark – DailyCoin
More Bitcoin price analysis is covered in:
Bitcoin: What to Expect in the Short and Long Term – DailyCoin
