
- Solana leads Q3 2024 in bridged net inflows.
- Ethereum retains market dominance but underperforms.
- Aptos challenges Solana with GameFi.
Ethereum continues to retain a dominant position among level 1 chains. However, its recent underperformance has made it vulnerable to challengers, especially Solana.
In Q3, Solana outperformed Ethereum in several key areas. Still, another chain, Aptos, threatens its position as Ethereum’s largest competitor.
Solana Surpasses Ethereum in Key Q3 Metrics
Solana had an impressive performance in Q3 of 2024, especially relative to its main competitor, Ethereum. According to a report by ETC Group, the network also ranked first in bridged net flows, recording $1 billion in net inflows. This demonstrates Solana’s capability to attract capital and increase its dominance in DeFi.
Sponsored
Solana’s network activity contributed to its outperforming Ethereum in price growth. For instance, Solana rose 14% in Q3, while Ethereum lost ground. However, it also faced competition from Aptos, which outperformed SOL.
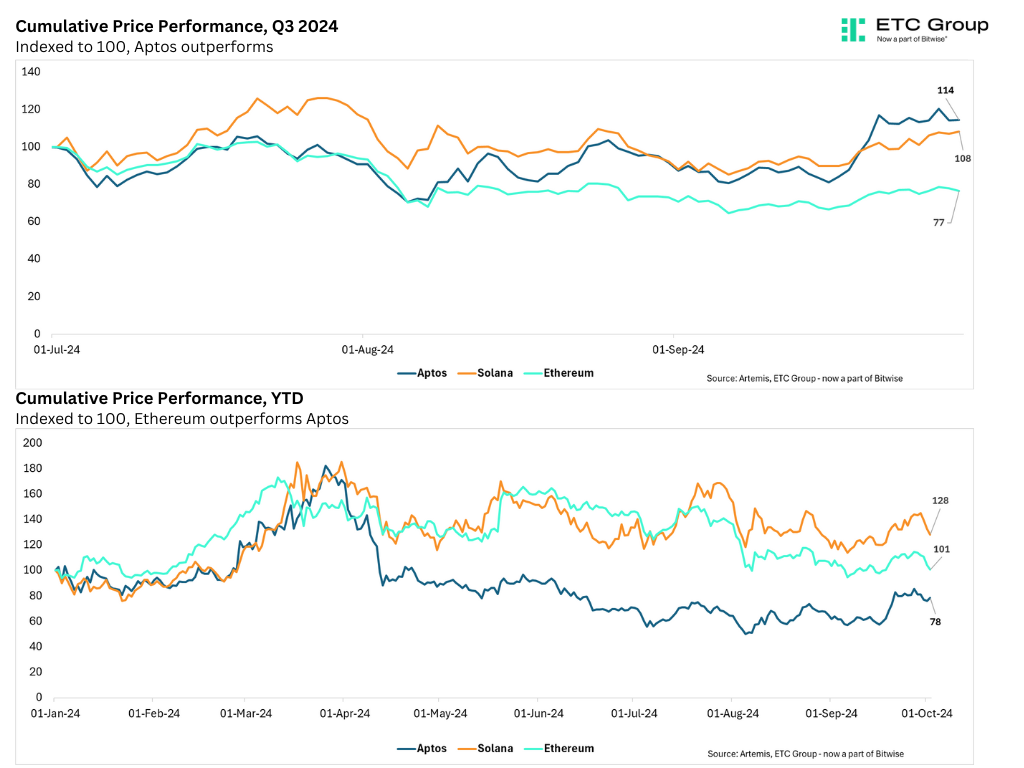
Aptos had a strong quarter thanks to the growth of its GameFi sector. In particular, the Tapos Cat Game and others have driven high transaction volumes. Still, Aptos underperformed both Solana and Ethereum in the past year. In terms of daily active users, Solana also remains ahead. User counts on Solana rose 82%, compared to 55% for Aptos on a quarterly basis.
Ethereum Remains Dominant in DeFi
Despite challenges from Solana, Ethereum retains its position as the dominant Layer 1 chain. Notably, the Comprehensive Network Dominance Index (CNDI) metric puts Ethereum at 45% dominance.
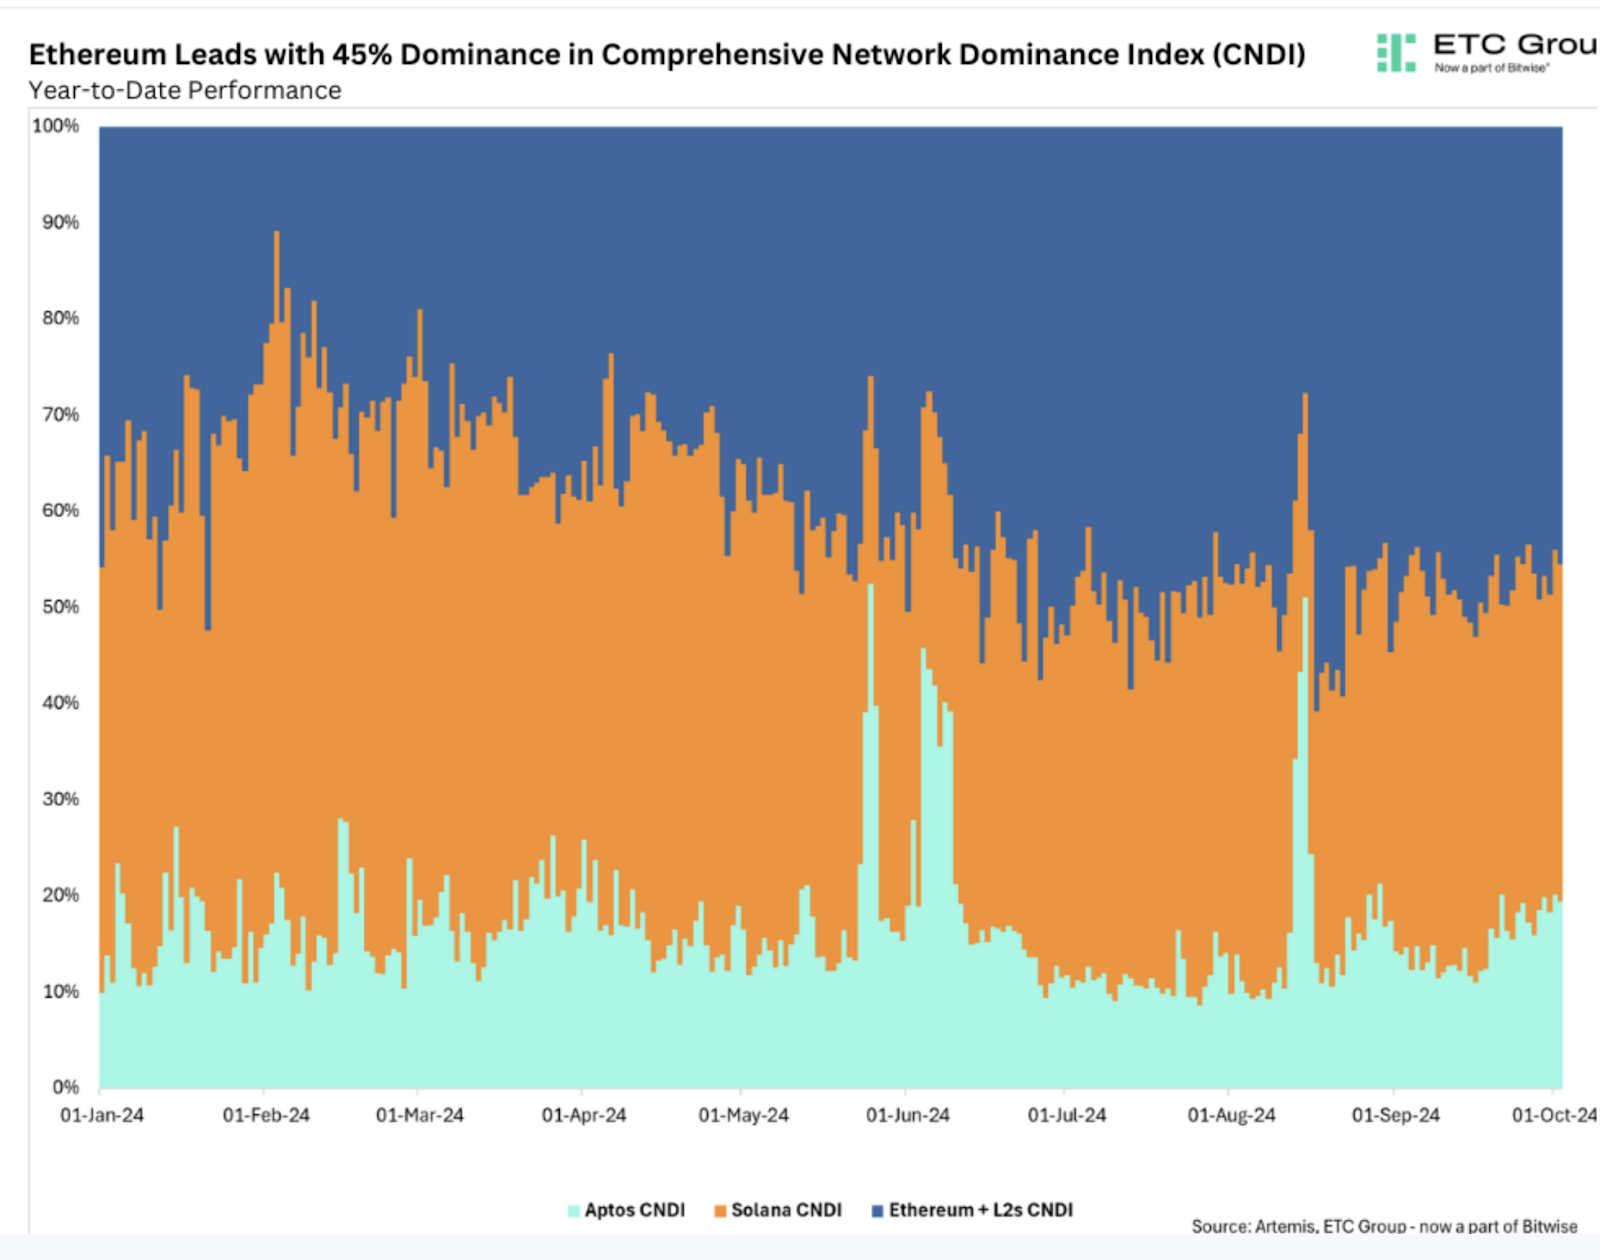
This index measures key performance metrics like Network Utilization Efficiency (NUE) and Economic Density Index (EDI). The utilization index measures how effectively a blockchain network converts its economic value into on-chain activity. The density index shows the intensity of transactions on the chain.
According to the ETC Group report, both metrics showcase Ethereum’s well-established infrastructure and extensive developer community. They also show why Ethereum remains dominant despite challenges from Solana and other chains.
On the Flipside
- Recent data suggests that Ethereum’s underperformance may be due to the rise of level 2 chains. By taking transactions of Ethereum’s base chain, L2 networks impact Ethereum’s inflation.
- Despite Solana’s and Aptos’ outperformance of Ethereum, ETC Group’s report suggests that investors should hold all three assets.
Why This Matters
Network activity has a key effect on the price of each asset. Investors should understand these metrics before they invest in any native token.
Read more about Solana’s competition with Ethereum:
Is Solana Ready to Flip Ethereum? Sygnum Bank Thinks So
Read more about AI and crypto:
GTAI Rallies 130% in 30 Days, Leads AI Tokens on BNB Chain