

Analyst Ali Martinez says Pudgy Penguins’ token is approaching a decisive moment. In a seven-part thread, he argues that the price of PENGU is exiting a low-volatility squeeze with multiple weekly indicators flipping back to constructive.
That means a larger upside move may be forming. The core claim is simple: buying interest is building up, and several classic signals are lining up on the same side.
Bollinger Bands are tightening on the weekly
Ali Martinez points first to a Bollinger Band squeeze on PENGU’s weekly chart. When the upper and lower bands contract, price volatility has finally compressed.
Sponsored
That kind of quiet often precedes a sharp expansion. He notes that several indicators currently lean toward an upside resolution rather than another leg lower.
DeMark, SAR, and SuperTrend all flash buy
The thread stacks three momentum tools.
- The Tom DeMark Sequential has printed two consecutive weekly buy signals — a 9 setup followed by a Combo 13. Martinez says that pairing can mark the start of a new bullish countdown window.
- Parabolic SAR has also flipped, with its dots now sitting below price. That shift is typically read as trend support and a move away from sustained bearish pressure.
- SuperTrend has turned to a buy as well. Martinez highlights the last comparable weekly SuperTrend signal on PENGU, which was followed by a 1,156% rally. Past performance is not a guarantee, but it is the historical reference he is using.
Channel targets: $0.025, then $0.045
With those signals aligned, Martinez maps PENGU inside a parallel channel. The mid-range near $0.025 is his first upside checkpoint. A clean break above that zone would open the channel’s upper boundary near $0.045 — roughly 430% above recent levels, by Ali’s count.
That is the stretch case, not a base case. The nearer test is whether price can reclaim and hold the mid-channel area after the squeeze resolves.
PENGU’s Spot cumulative volume delta moved in lockstep with the PENGU price advance, providing additional evidence of stronger net buying activity along with a heavy crypto whale presence rather than a short-covering bounce.
Why the setup is getting attention
Martinez’s argument is not that PENGU has already broken out. It is that low volatility is meeting a cluster of weekly buy signals at the same time. Squeezes can resolve in either direction. His read is that the weight of the indicators currently favors the upside.
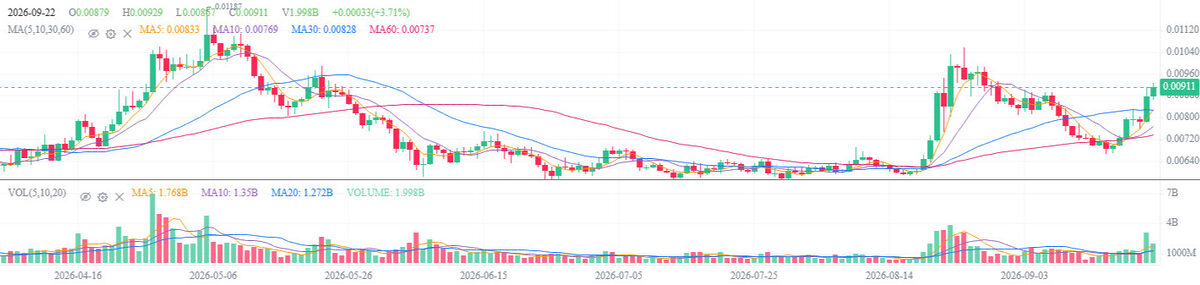
For traders watching memes and NFT-linked tokens, the practical takeaway is narrower: the weekly chart is compressed, several trend tools have flipped, and the first levels that matter on his map are $0.025 and then $0.045.
Whether PENGU delivers the “bull run” Ali Martinez is calling for will depend on whether price can break the squeeze with follow-through — not on the signals alone.
Discover DailyCoin’s popular crypto news today:
Bitcoin Price Hits $85.4K as Short Liquidations Surge – How High Can BTC Go?
The CLARITY Vote Excuse Doesn’t Sit Right With Schwartz