
The highly-popular Hedera Hashgraph (HBAR) altcoin has become the talk of the crypto town once discussions around HBAR integration into SWIFT surfaced. On the other hand, the 6.3% downswing since yesterday has pulled Hedera’s price below the $0.17 resistance line.
HBAR’s 91% Yearly Gains Fuel Optimism
Zooming out of the charts, SWIFT testing HBAR has definitely had a positive impact on the yearly altcoin’s performance, whipping up 91.6% gains in a 365-day time window. Crypto analysts such as Coinvo now strictly believe in HBAR price breaking through $0.22, a level unseen since May 12, before taking off for $0.35.
However, the issue with this bullish HBAR thesis is that the price smacked back under the trend-line, meaning that the $0.35 short-term target portrayed in the chart above can be invalidated with a few on-chain signals going the wrong way.
Here’s What TOP 3 On-Chain Metrics Say
After two weeks of consolidation around the $0.16 area, HBAR price is potentially looking into some drastic fluctuations. All three key on-chain metrics point to HBAR bulls lacking power since June 11, when Bitcoin (BTC) started retracing from the latest $111K milestone.
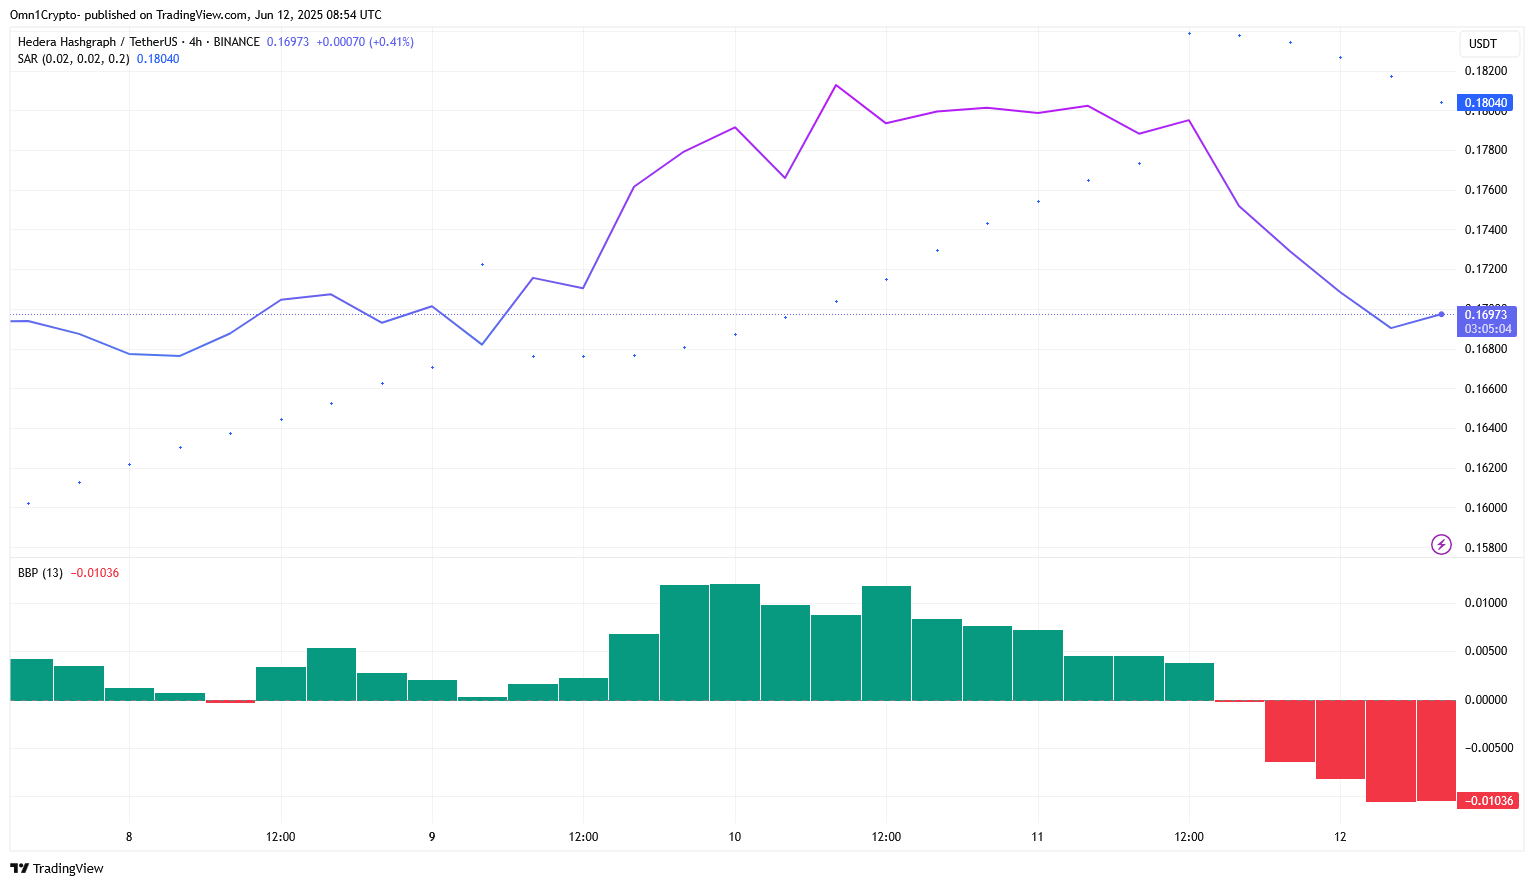
Firstly, the Parabolic Stop & Reverse (SAR) signal, pictured in blue dots above the price, hints at HBAR bumping into a sell wall at this price range. Then, the Bull Bear Power (BBP) scales suggest the same, getting into the red territory since Monday afternoon.
Another key sign of crypto bears, otherwise known as short-sellers, controlling the market is the negative Chaikin Money Flow (CMF). This crypto whale tracking financial device allows us to understand the largest crypto player sentiment around HBAR’s real-time momentum.
Indeed, the CMF still kept a positive balance on Tuesday morning, when HBAR price briefly tackled $0.18, but is dwelling well below zero right now, according to TradingView’s 4-hour charts. As of press time, the #26 ranking Hedera native crypto HBAR is priced at $0.169.
On The Flipside
- Hedera’s charts displayed an ultra oversold status on the Stochastic Relative Strength Index (StochRSI).
- Contradicting with the Parabolic SAR, the StochRSI implies HBAR is in massively underpriced territory.
Why This Matters
Increased price volatility can amplify both profit & deficit. Analyzing technical crypto implications gives an edge to crypto traders striving to stay ahead of the mass market moves.
Discover DailyCoin’s popular crypto news:
Ukraine’s Bitcoin Reserve Inches Closer With Crypto Bill Draft
ETH ETF Hits New Record: Ethereum Price Setup Primed For $10K?
People Also Ask:
HBAR fell 6% to $0.169 today due to bearish market pressure, but strong on-chain trading volume and support at $0.1789 could drive it toward $0.35 if buyers hold firm. Investors should remain cautious given current volatility.
Hedera’s network shows robust enterprise adoption and stablecoin growth, but today’s 6% drop reflects market uncertainty. Strong fundamentals, like HBAR partnerships with SWIFT, suggest potential for recovery if sentiment improves.
Sellers are exerting pressure, with the Relative Strength Index at 38.68 indicating possible oversold conditions, but a drop below $0.1789 could delay the $0.35 goal. Buyers must defend support and overcome resistance at $0.23 to regain momentum.
HBAR’s fundamentals are solid, with 2025 price predictions ranging from $0.2231 to $0.43, but today’s decline warrants caution. Investors should research on-chain metrics like trading volume before entering the market.
Key terms include “HODL” (holding through volatility), “FOMO” (avoiding impulsive buying), and “whale” (large traders impacting prices). Monitoring platforms like X for whale activity can provide insights, but always verify with reliable data.