
The bearish macroeconomic outlook after Donald Trump’s team activated the imposed tariffs has put the general crypto markets into unease. However, Bitcoin (BTC) has found its floor amidst positive FOMC meeting results, with several major-cap altcoins including Ripple (XRP), Stellar Lumens (XLM) and Hedera Hashgraph (HBAR) recording 5-10% bounce back rallies on Wednesday.
Sponsored
Hedera’s distributed ledger presents a technology that’s being tested by SWIFT monetary system for a potential integration into the globe’s most popular banking type. HBAR price has gathered up an 80% yearly return in 365 days, but the $8 billion-worth Hedera (HBAR) backtracked over 40% from its 3-month peak at $0.37 in late January, 2025.
Presently, seasoned crypto analysts are looking into the falling wedge ornament that has just occurred on HBAR’s daily chart. Some analysts such as Bitunix team expect a 85.8% bull run for HBAR’s price by the end of 2025, but that would still be far from the all-time high of $0.5692, scored over three years ago, according to CoinGecko.
HBAR Bottomed Out? Key Price Levels To Watch
HBAR ETF applications and SWIFT testing piqued the interest of crypto aficionados, who jumped into this utility altcoin in early March, bumping the total market cap back to nearly $12 billion. The roller coaster ride since then was so bumpy for HBAR, that a $4 billion market cap hole has thrown the altcoin out of the global TOP 20 by market cap.
On a brighter note, HBAR price successfully rebuffed the $0.182 key support territory thrice this week, picking up 4.4% gains on Wednesday in a rebound rally to approach $0.20 as of publication time. A continuous bull streak could be expected only if HBAR manages to close the day above the red upper-tier Bollinger Band, pictured in the graphic below.
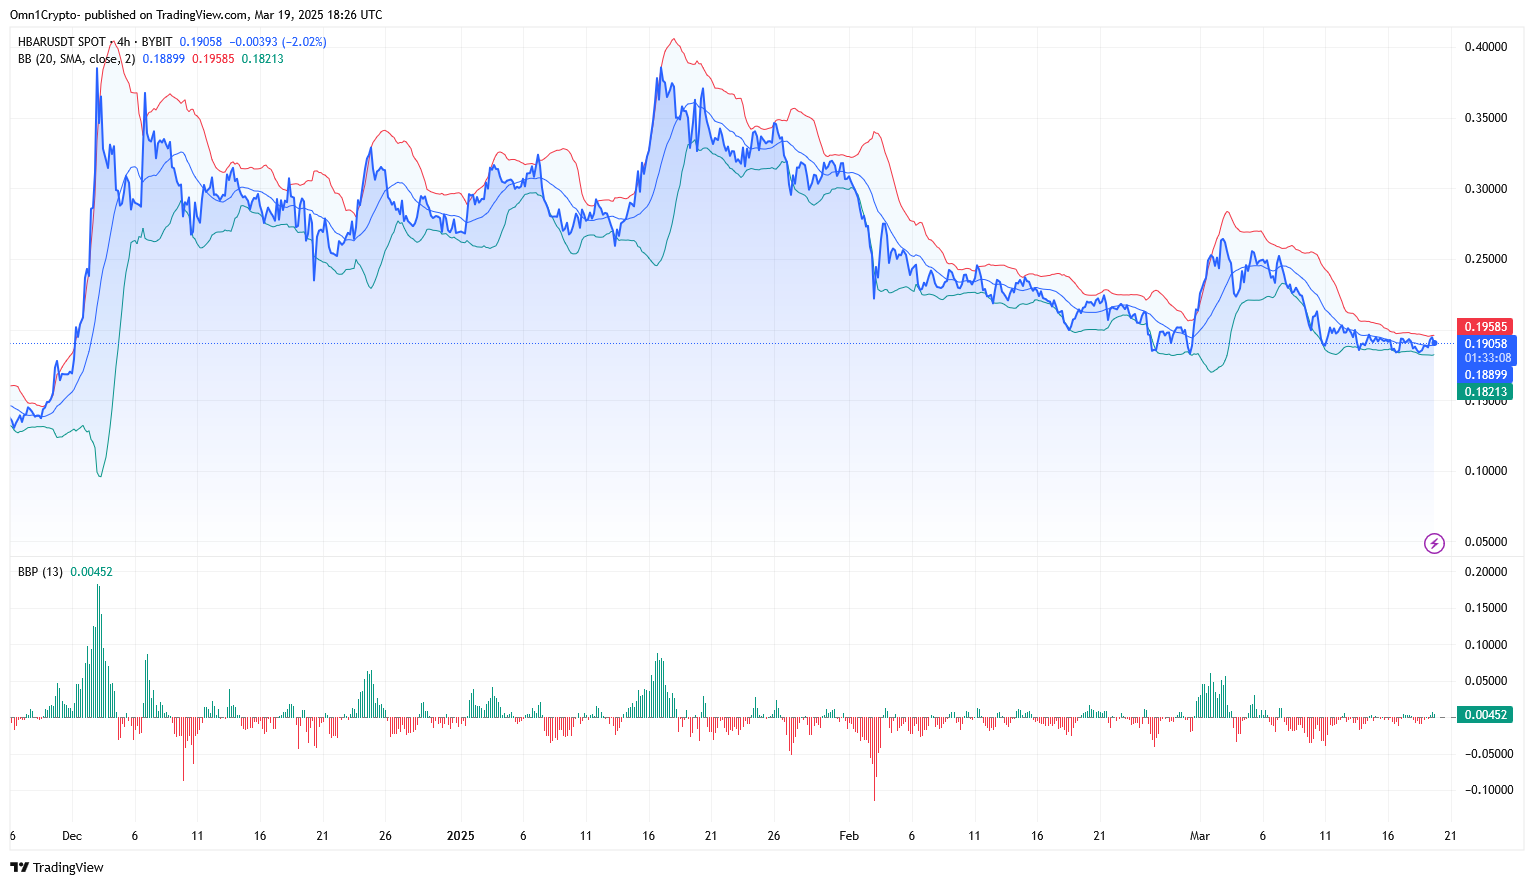
As of now, the altcoin’s price has broken through the middle band in the Bollinger Band (BOLL) structure. Aiming for the red line, a bull breakout confirming territory starting at $0.19585, HBAR is currently priced half a cent below this level, with the Bull Bear Power (BBP) metric flashing a slight advantage for crypto bulls on the 4-hour price charts.
On The Flipside
- The HBAR exchange-traded fund (ETF) filing by Canary Capital has been approved by NASDAQ, which are now seeking the nod from U.S. Securities and Exchange Commission (SEC) to proceed.
- The underlying crypto behind Hedera Hashgraph (HBAR) could receive a substantial boost if the altcoin becomes among the first ones to be included in an openly traded crypto ETF item.
Why This Matters
Technical patterns such as the falling wedge give investors an edge over sentiment based decisions, while Bollinger Bands allow to comprehend and adjust to the level of incoming price volatility.
Stay in the loop with DailyCoin’s top crypto news:
XRP Bulls Push For $3 In Spite Of Ripple vs. SEC Case Delay
Raydium Price Soars as Solana’s DEX Strikes Back at Pump.fun