

Investors poured capital into Canary’s HBAR ETF on November 4, resulting in a net inflow of $2.73 million, according to the statistics from SoSoValue. This marks the best-performing day for Hedera-based exchange-traded funds (ETFs) since mid-January, 2026. Capital rotating at such a fast speed doesn’t occur without reason: institutions are typically buying the dip.
$3 Million Inflows Shock The Market, Price Lags
Pulling in millions of dollars a day is rather rare for Hedera-based stock on traditional markets: Canary Capital’s ETF product saw 10 dry days in a row back in October, while the daily value traded only exceeds $1 million on a rare occasion. This now puts the cumulative net flow at $116.66 million, pushing the ongoing-week inflows to $3.01 million.
This week’s shift hints at corporate buyers believing in Hedera Hashgraph’s (HBAR) long-term value and may be possibly looking for the local bottom. Judging from the latest HBAR price analysis from analyst Gopal, HBAR presents a cautiously-bullish case with bulls needing to defend the $0.065 support one and reclaim wedge resistance for confirmation.
The veteran analyst’s 4-hour HBAR price chart depicts the price consolidating near $0.068 support amid fading selling pressure, presenting a cautiously bullish outlook. For the falling wedge to hold weight, Hedera’s price would have to conquer the confluent resistance from $0.075 to $0.08. If bears dominate, $0.058 provides the next demand territory.
Moving-Average Ribbon Uncovers The Real Issue
Another key hurdle is HBAR’s moving averages. Judging from the spectre provided by the Moving-Average Ribbon, HBAR’s price is presently trading well below all four thresholds. The massive cluster of moving averages is located between $0.07545 and $0.08665, while HBAR’s SuperTrend price was situated slightly above $0.08. Any close below keeps it in the red zone.
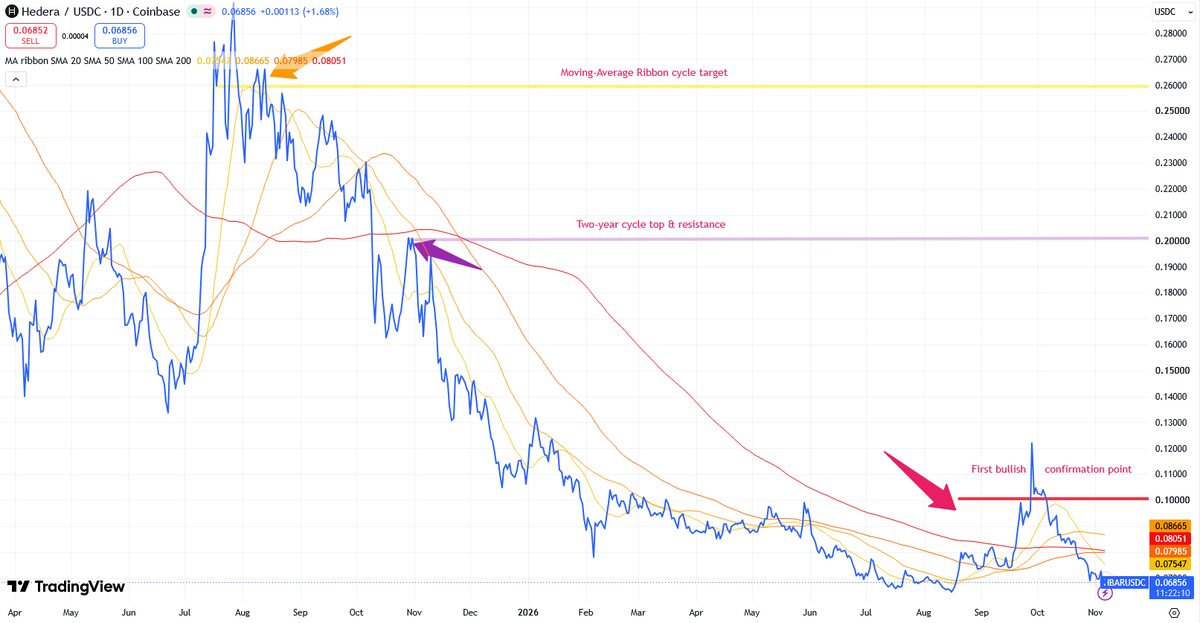
Now, Hedera Hashgraph (HBAR) has to break out of the aforementioned falling wedge by reaching $0.10, which is also a historical confirmation point for HBAR’s bulls. Going upward, momentum could take the altcoin’s bulls towards retesting the double top located at $0.20. Measuring by the Moving-Average Ribbons, roughly $0.25 becomes plausible in the long-term.
Delve into DailyCoin’s trending crypto news right now:
US Democrats Sweep Midterms: Bitcoin Back to $78K, Stock Market Wobbles
Social Security November Payments: Why Dates Shifted This Month