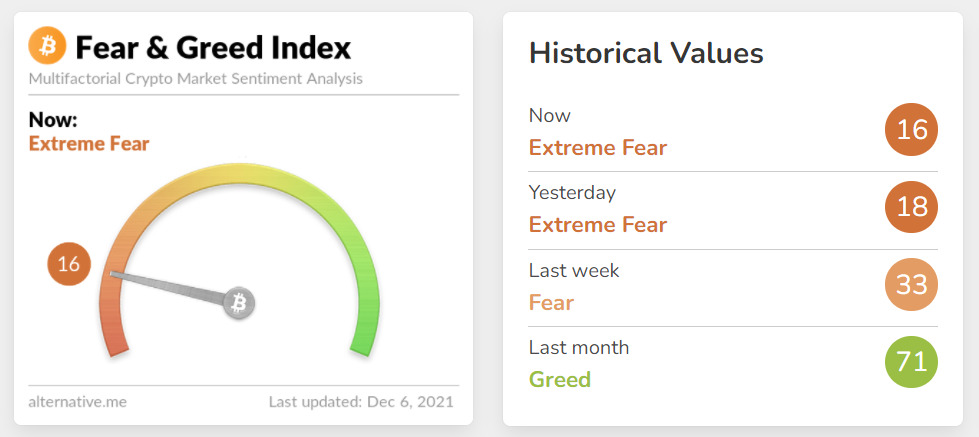
The more than 20% drop across the cryptocurrency space over the past 72 hours has caused tens of billions of dollars in both realized and unrealized losses as well as significant concern among retail investors. In fact, a key measure of investor sentiment – known as the Crypto Fear & Greed Index (FGI) – shows that the cryptocurrency market is currently in a state of “Extreme Fear” per the latest index update as of Sunday night, Dec. 5, pictured below.

The FGI, is a free, easy-to-use, interactive dashboard that provides a daily snapshot of the general market sentiment based on a variety of weighted factors that include: volatility, market volume, social media, dominance, and trends.
The software automatically scrapes the Internet and updates these factors every 24 hours. The algorithm then calculates the FGI score for the day, and then plots it on a 0-100 scale with 0-50 representing varying degrees of Fear and 50-100 representing varying degrees of Greed.
Sponsored
According to the developers of the FGI website, the crypto market behavior is very emotional.
“People tend to get greedy when the market is rising which results in FOMO (Fear of missing out). Also, people often sell their coins in the irrational reaction of seeing red numbers. With the Fear and Greed Index, we try to save you from your own emotional overreactions. There are two simple assumptions:
- Extreme fear can be a sign that investors are too worried. That could be a buying opportunity.
- When Investors are getting too greedy, that means the market is due for a correction.
Therefore, we analyze the current sentiment of the Bitcoin market and crunch the numbers into a simple meter from 0 to 100. Zero means ‘Extreme Fear,’ while 100 means ‘Extreme Greed.’ “
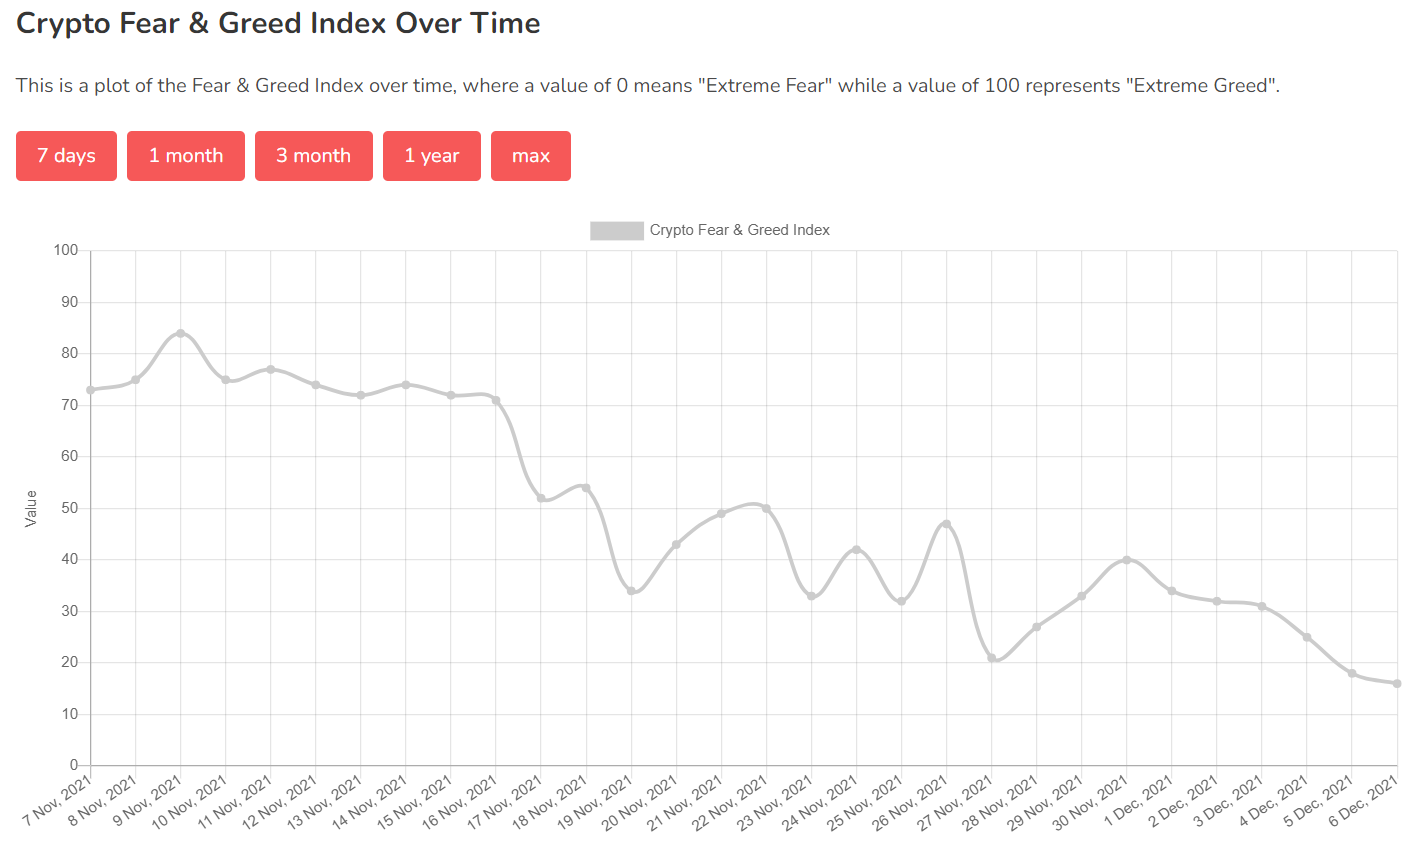
Another interesting feature of the FGI website is that you can look back historically and see the trend line shifts over time, which can be helpful to correlate the line’s movement with specific fundamental and technical events.
You can look at the timeline over the past seven days, month, three months, year, and the “max” view which dates back to the creation of the FGI in early 2018. This chart immediately below, looks at the past month.

You can see the shift from an “Extreme Greed” measure of 84 on Nov. 9 compared to the “Extreme Fear” measure of 16, which was logged yesterday – that 68 point swing occurred within fewer than 30 days. Such shifts confirm the power that emotions can have on behavior when it comes to crypto investing.
On The Flipside
- Many contrarian investors would recommend that during this type of downturn in sentiment is the prime time to buy the dip when others are afraid.
Why You Should Care?
During local down cycles, keep your cool. Despite this temporary drop, the crypto fundamentals are still positive and the macro technical trend is still bullish.

