
Opening the year trading sideways, cryptocurrency markets have experienced their sharpest decline since the flash crash of December. The crypto market sell-off has seen more than $200 billion wiped off from the global crypto market cap.
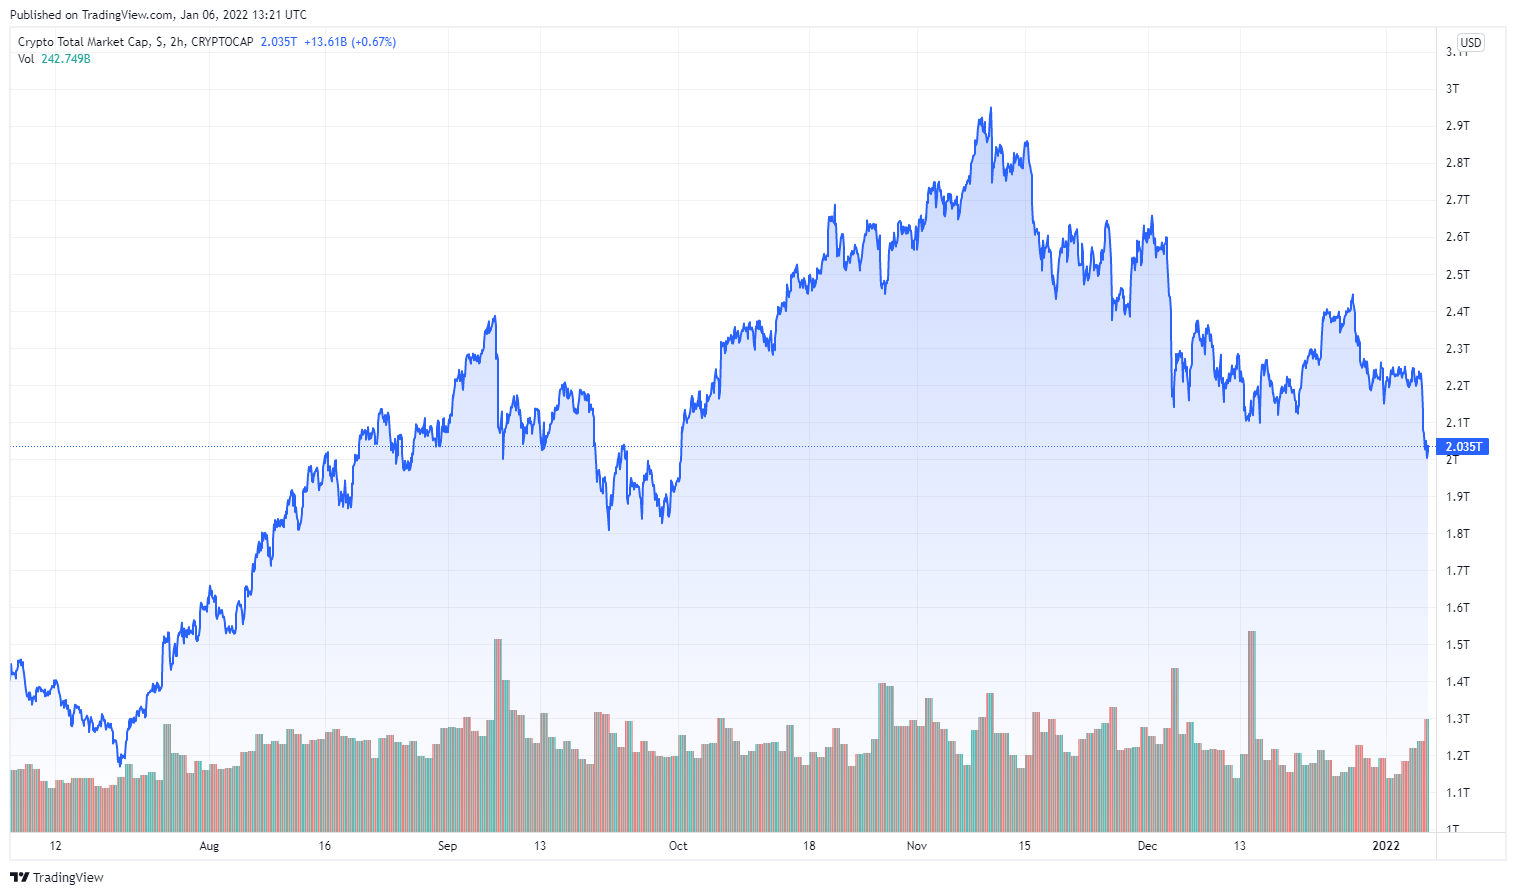
The total market cap over the last 6 months. Source: TradingView
With most cryptos dropping by double digits, the global crypto market cap has reached its lowest point since September 2021. While crypto markets are known to be volatile, a slump of this magnitude has been linked to certain events.
Fed Report Sparks Market Slump
In December, reports from the Federal Reserve’s December FOMC session suggested that the United States would be halting its stimulus efforts and increasing interest rates in 2022. With the confirmation of that report, global stock markets plunged into decline.
Sponsored
Joining the global stock markets hours later, the volatility of crypto markets was highlighted once again. The crypto market dropped more than 10% of its cumulative value. The market, which hit a $3 trillion valuation in November, is now at $2.035 trillion.
Over the last 24 hours;
Sponsored
Bitcoin has lost 7%, now trading at $42,981
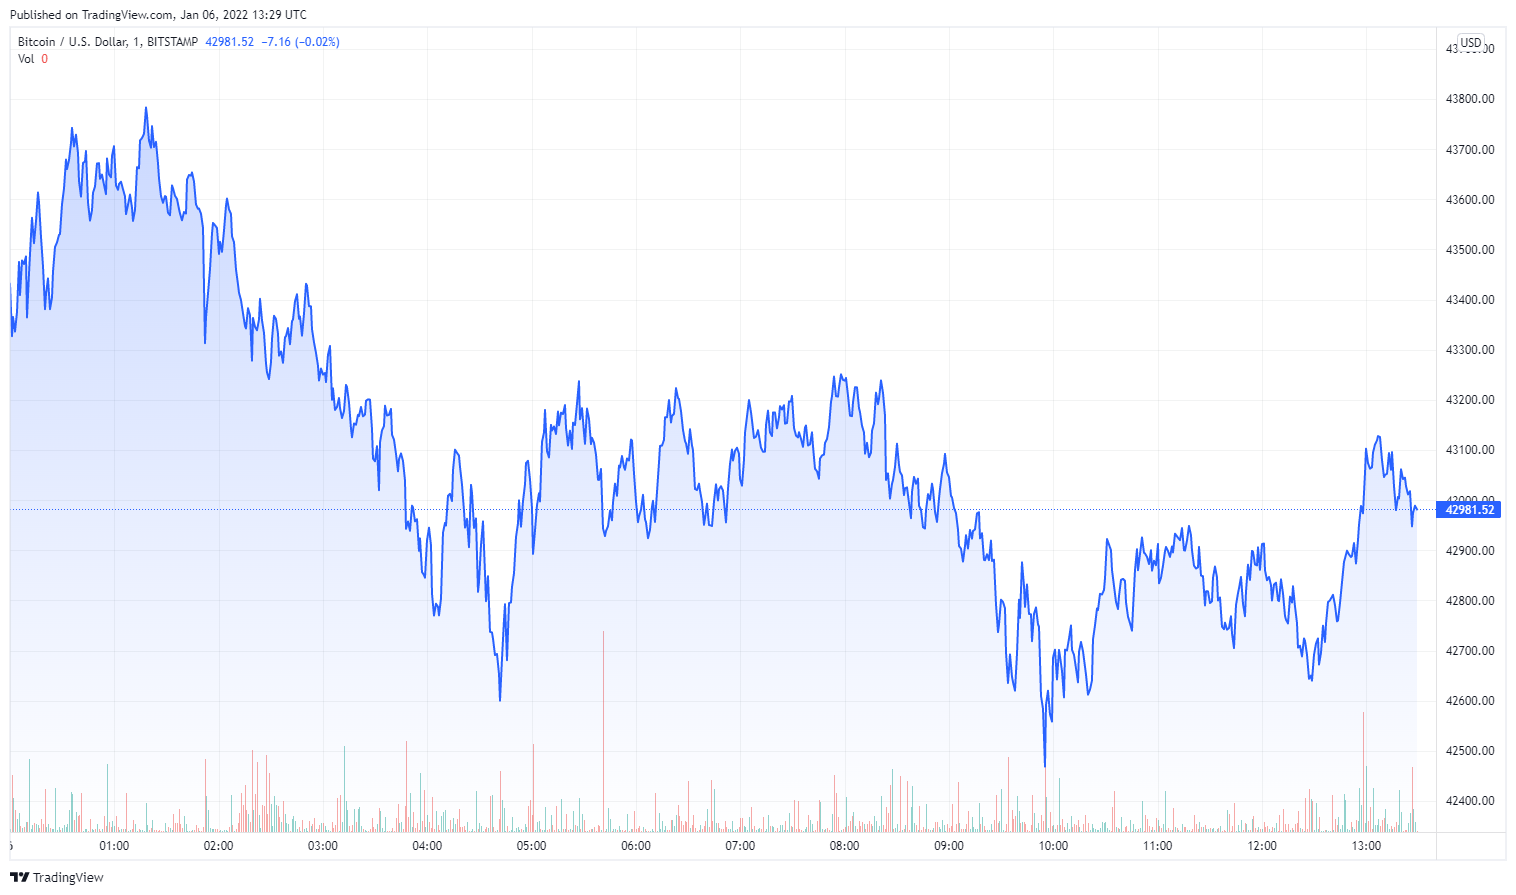
The 24 hours price chart of Bitcoin (BTC). Source: TradingView
Ethereum has fallen by 11%, now trading at $3,374
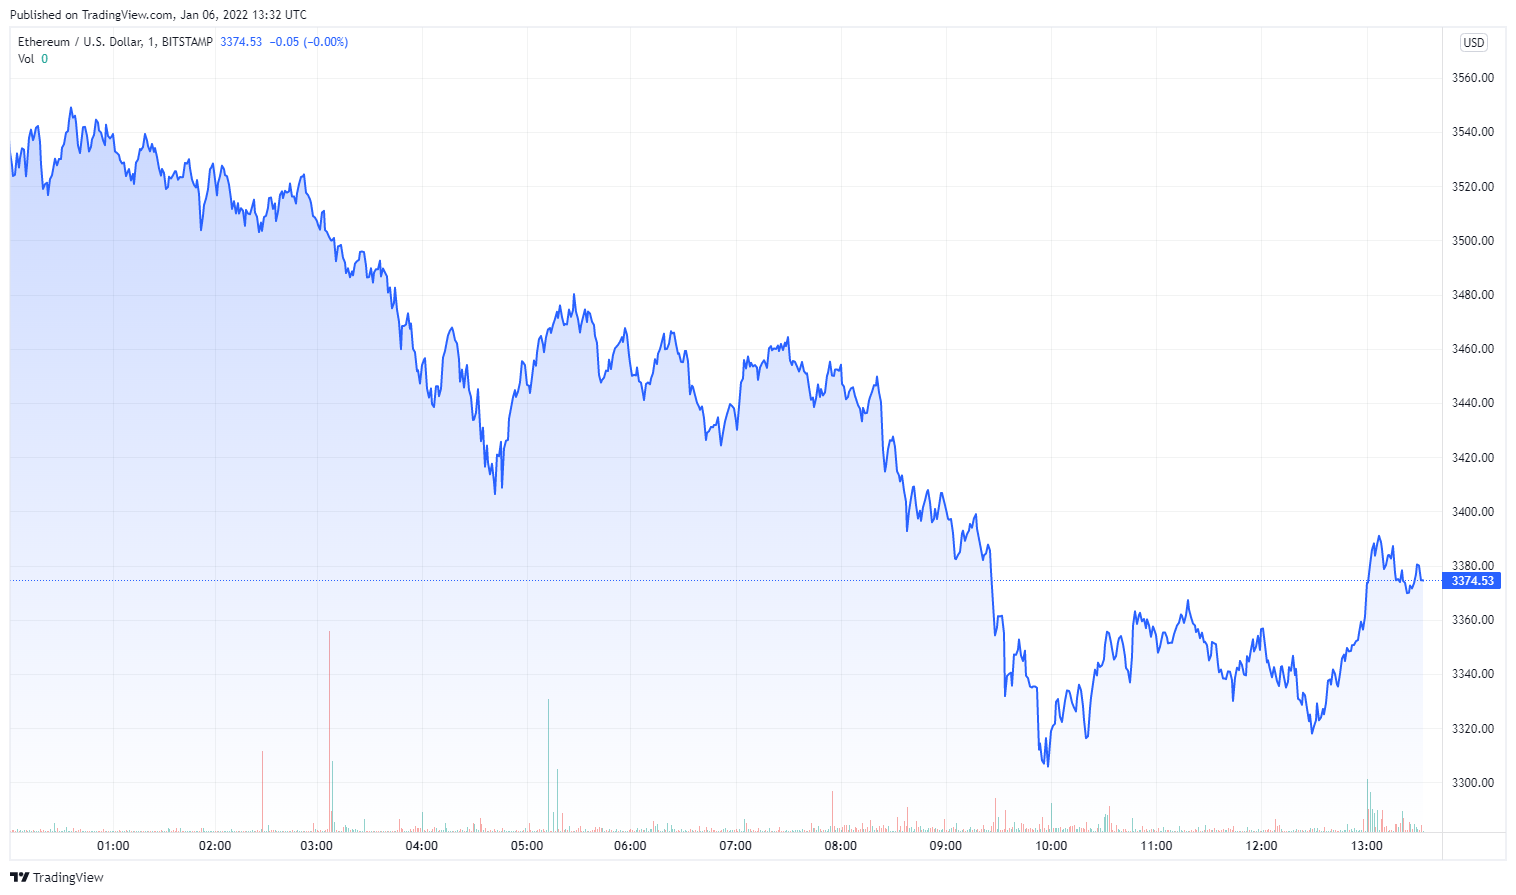
The 24 hours price chart of Ethereum (ETH). Source: TradingView
Binance Coin (BNB) has lost 9%, now trading at $465.5
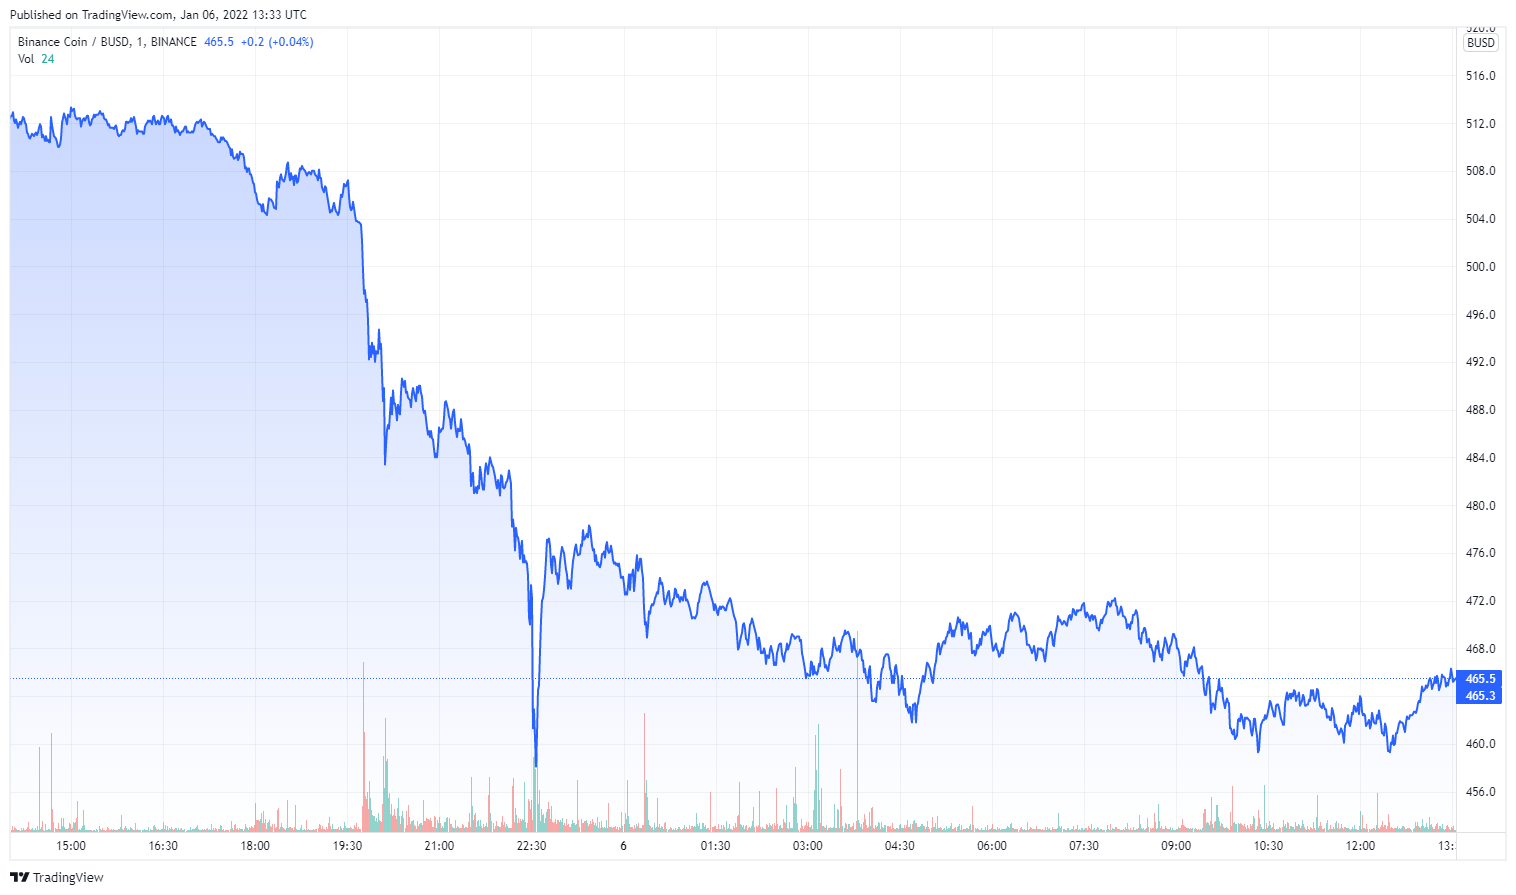
The 24 hours price chart of Binance (BNB). Source: Tradingview
Solana has lost 12%, now trading at $148.46
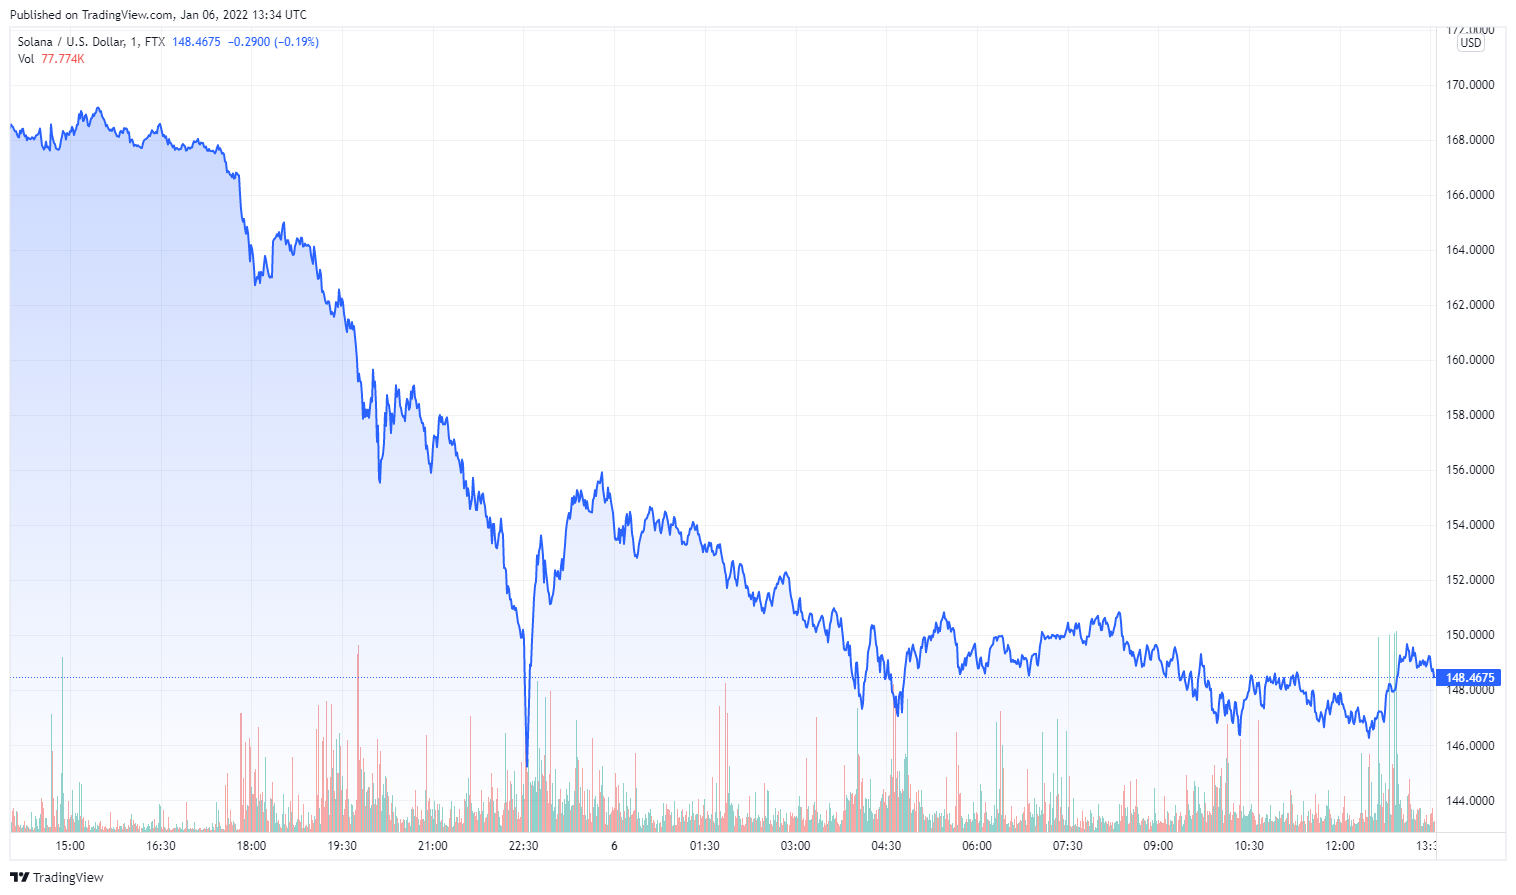
The 24 hours price chart of Solana (SOL). Source: TradingView
Cardano (ADA) has lost 8.5%, now trading at $1.21549
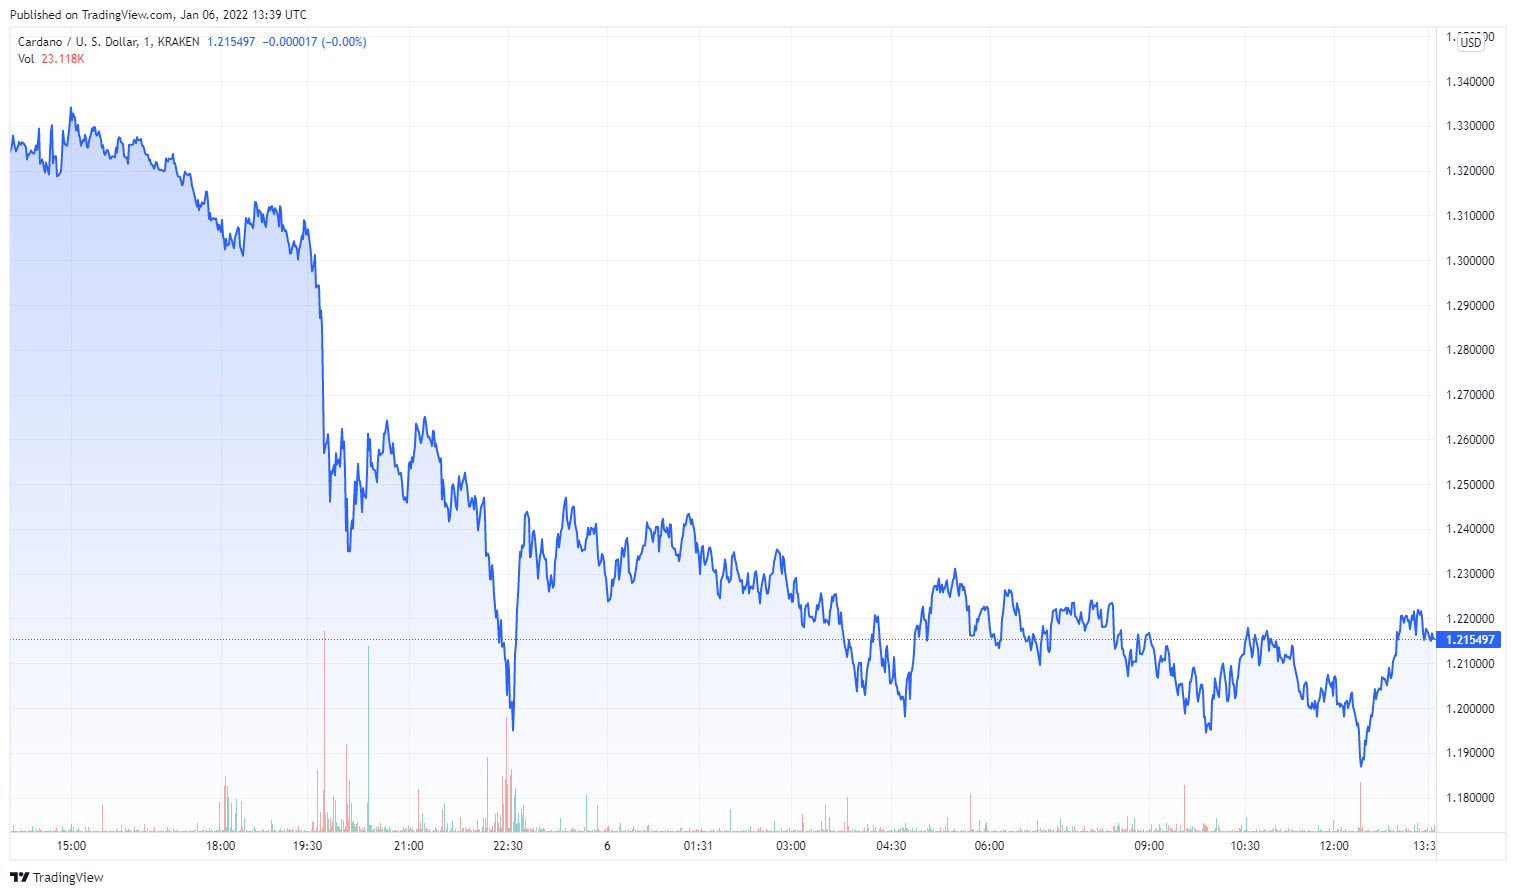
The 24 hours price chart of Cardano (ADA). Source: TradingView
Ripple (XRP) has lost 8.4%, now trading at $0.75525
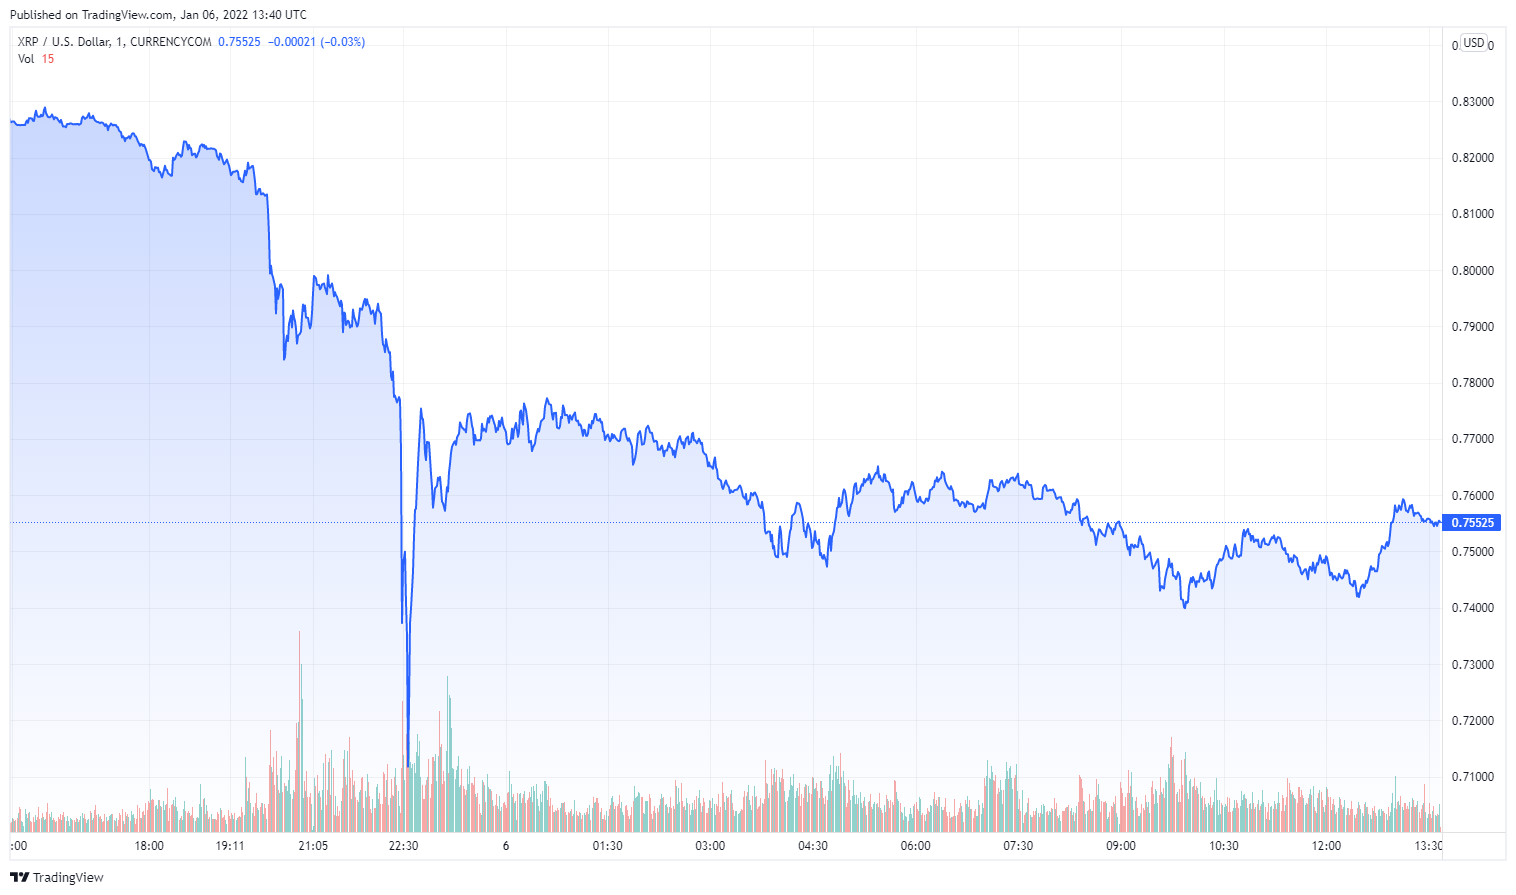
The 24 hours price chart of Ripple (XRP). Source: TradingView
Terra (LUNA) has lost 11%, now trading at $75.895
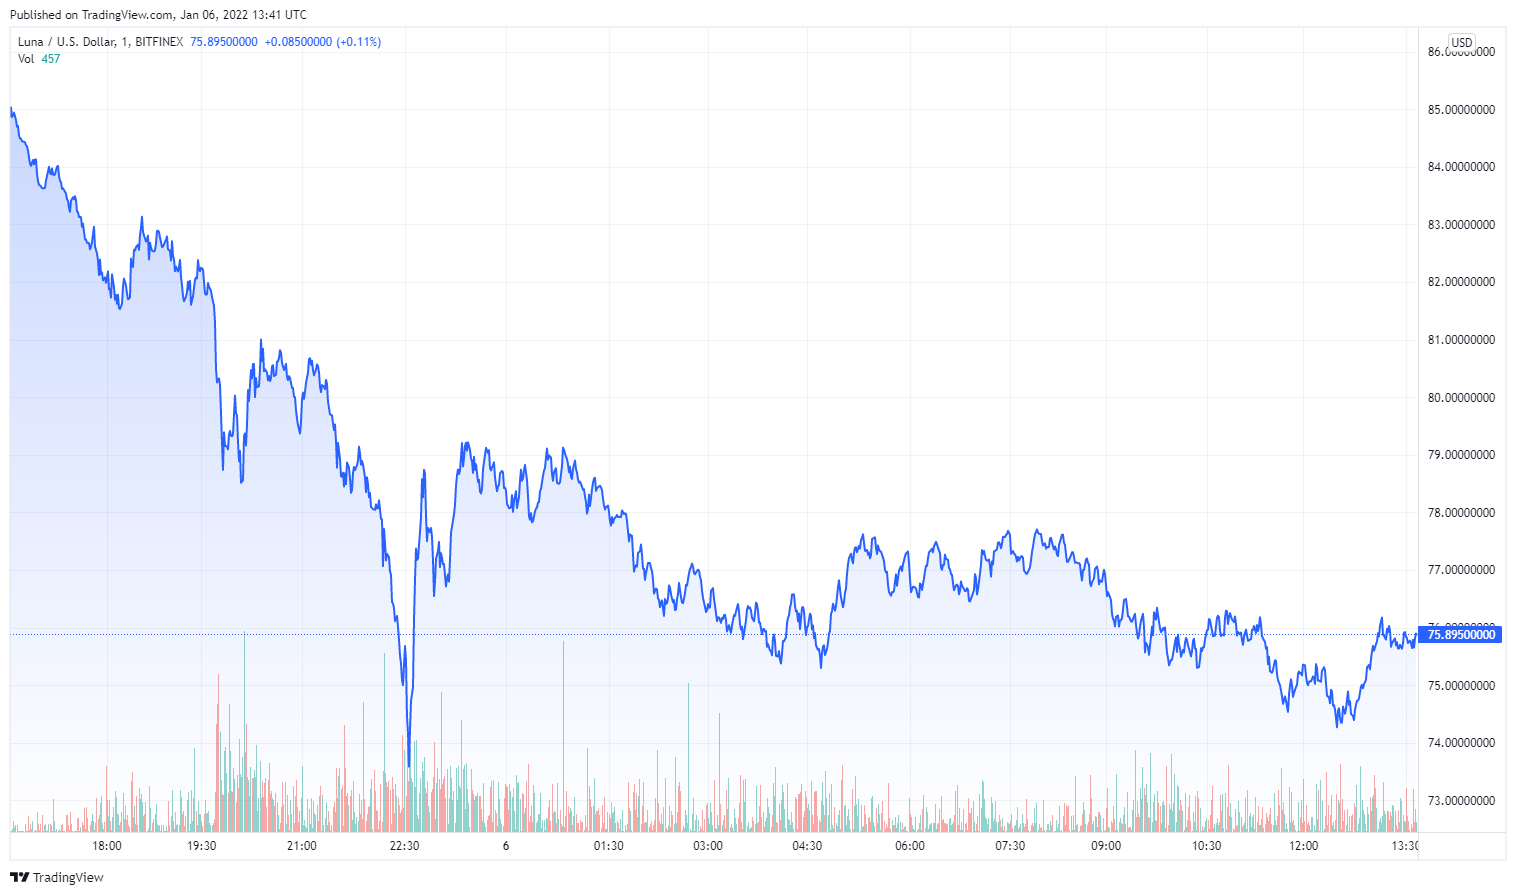
The 24 hours price chart of Terra (LUNA). Source: TradingView
Polkadot (DOT) has lost 13.5%, now trading at $26.0216
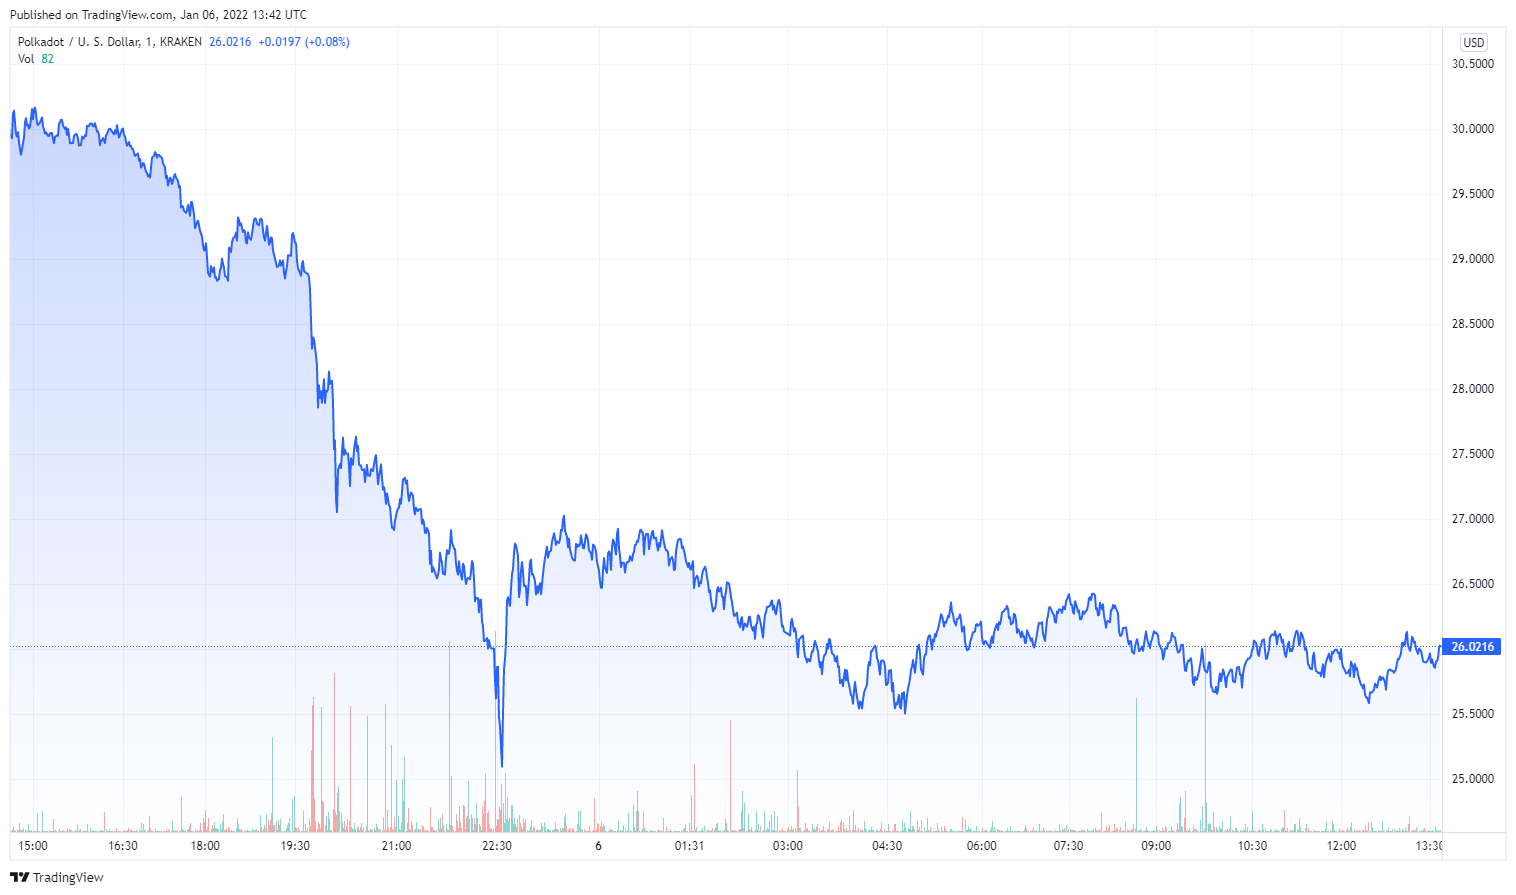
The 24 hours price chart of Polkadot (DOT). Source: TradingView
Another possible reason for the drop could be traced to the mining of Bitcoin in Kazakhstan. Following growing protests sparked by fuel costs in Kazakhstan, the government cut off the country’s internet access. As it did, more than 18% of the world’s Bitcoin hashrate disappeared.
On the Flipside
- Despite a major sell-off, many investors still hold on to their predictions for 2022. With many suggesting Bitcoin will hit $100k this year.
