
The price of Bitcoin fell to $15,653 on the 9th of November, which was its lowest point since November 2020. But the price has been consolidating. It is forming a symmetrical triangle, which indicates indecision, as the same amount of pressure is applied from both sides.
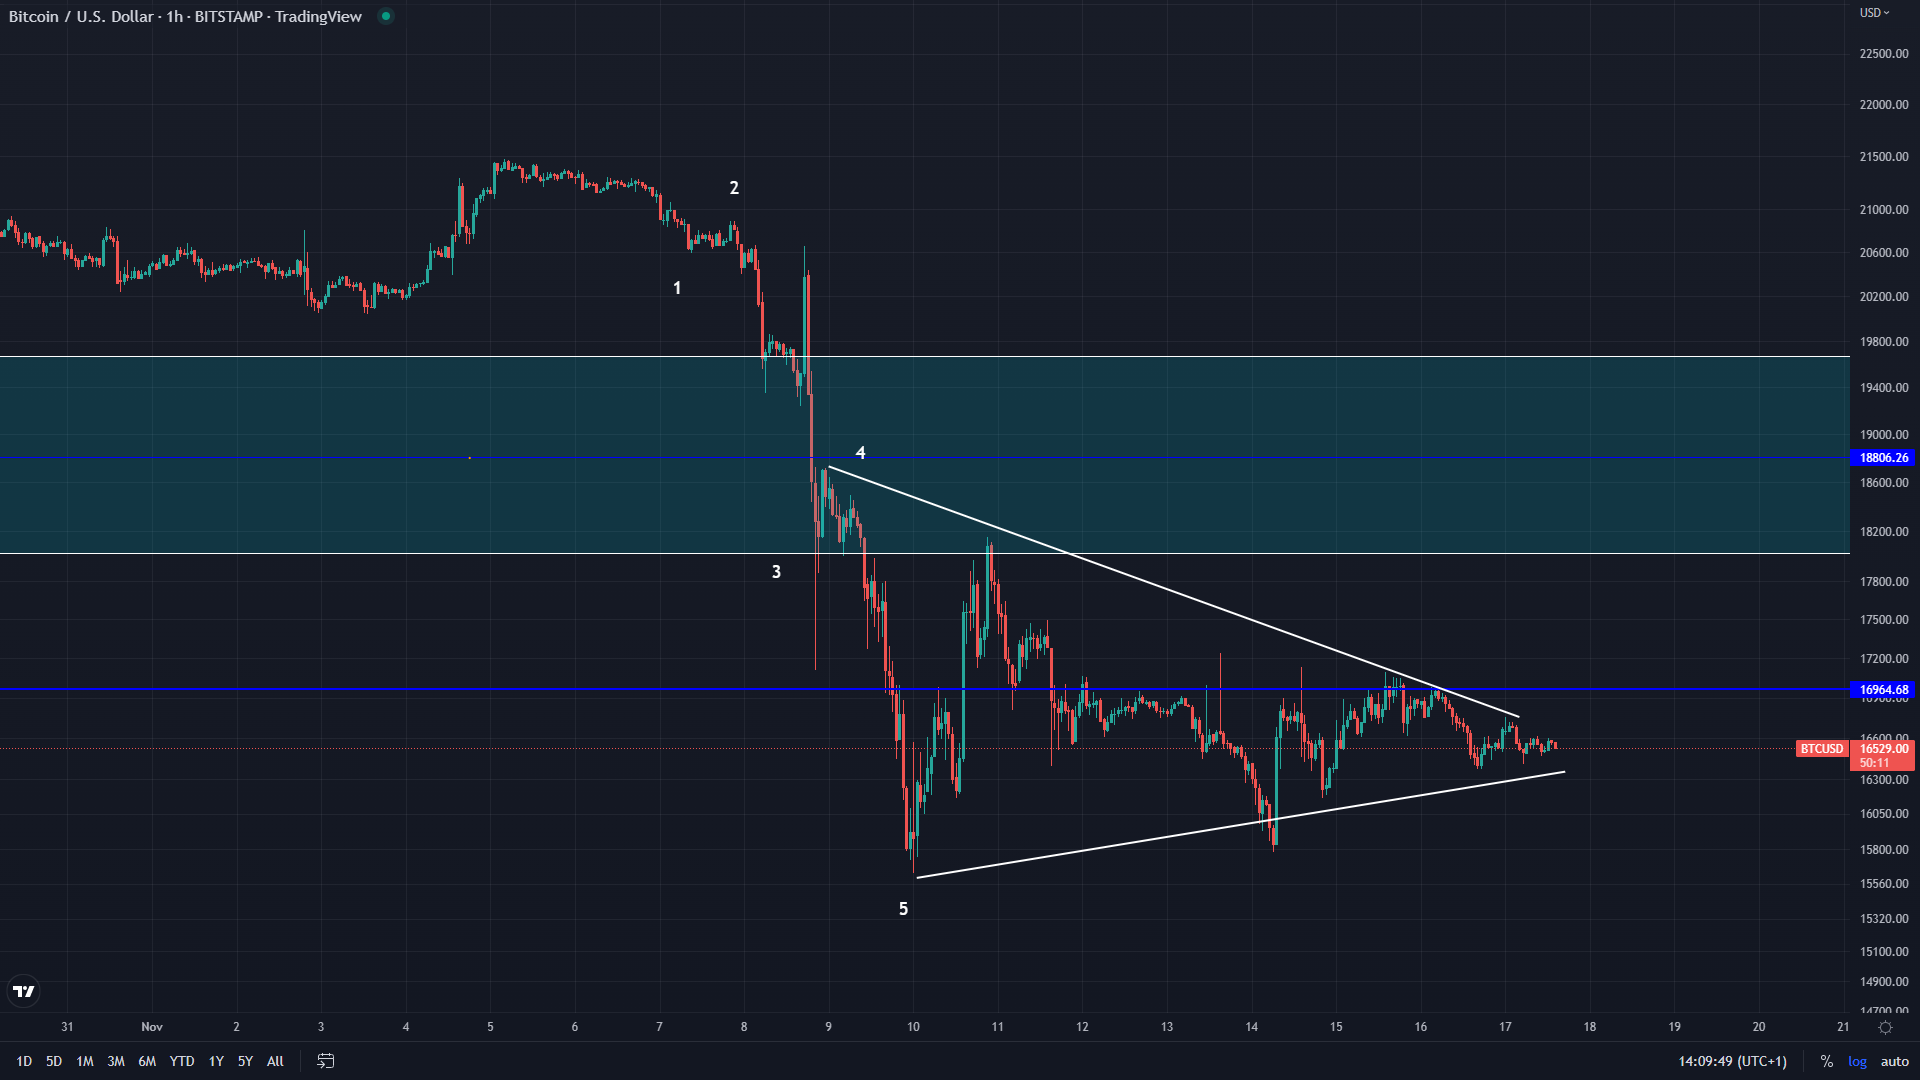
Making a lower low than the one on the 18th of June could signify that new lows are on the horizon. However, that might not just happen in a straight line.
As can be seen from the hourly chart above, from the 5th of November there was an impulsive move to the downside that clearly ended. What followed was a recovery to significant prior support, now tested for resistance in the $18,000 area. The price is now hovering around the triangle median point and is getting close to its apex.
Sponsored
With a breakout shortly coming the main question is, what would be its direction?
Bitcoin Price: Bullish Count
If the ascending move from the 9th to the 10th of November was a five-wave one, it could imply a bullish count. According to this count, we have seen the first two waves of the Minute count and the first two sub-wave of the Minuette count from the third wave, which is projected to go to the upper resistance level of the previous support zone, at around $19,694.
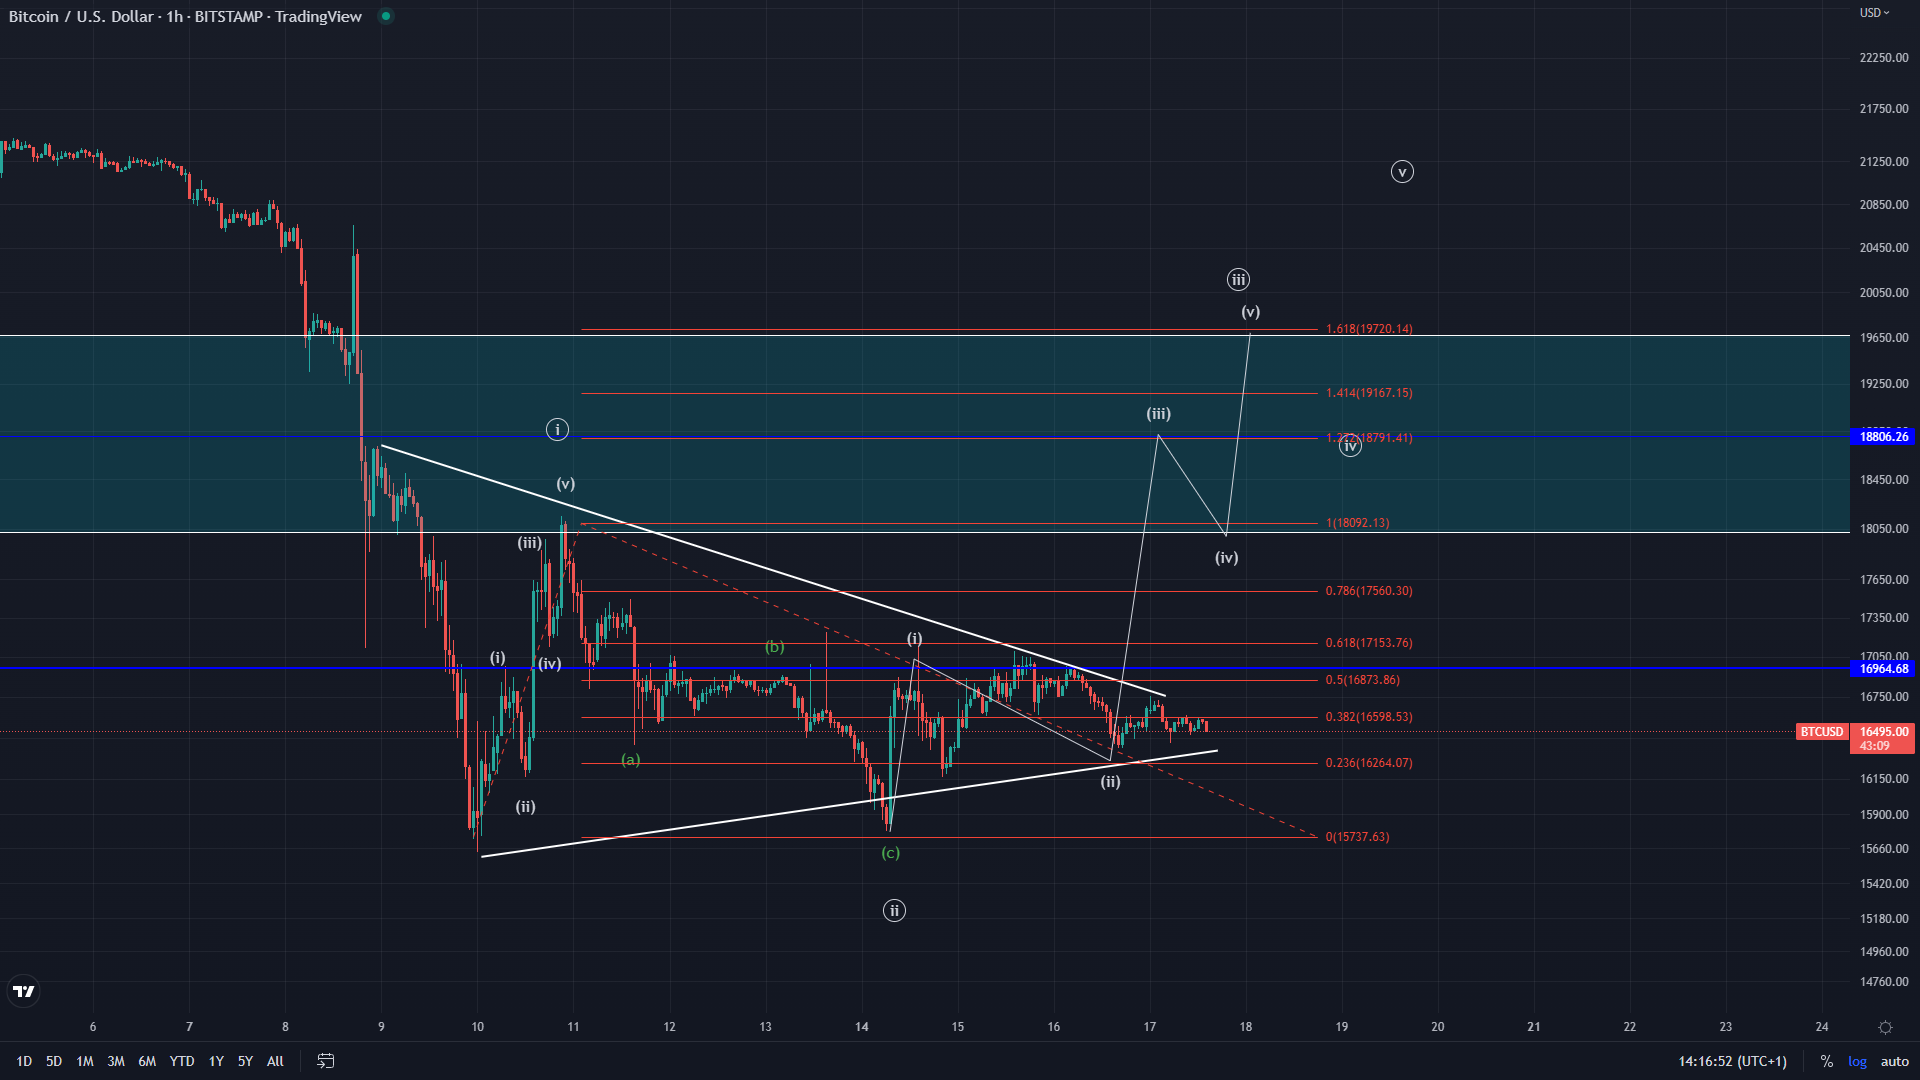
This target is also validated by the Fib extension level, as the third wave from the five-wave move usually comes to 1.618 Fib extension level. These two levels perfectly overlap, which points out the significance.
If this is true, then a breakout to the upside is likely to come next with further upside ahead, leaving the 9th November low behind. There can be a possibility of even further upside after that for the fourth and the fifth wave to develop, but this whole move from the 9th of November can also be a three-wave ABC correction.
Even if it’s corrective, the still target remains for a potential 3rd wave, be it a C wave or the third one from a five-wave impulsive move.
Bitcoin Price: Bearish Count
Alternatively, the ascending move from November 9th until the 10th can potentially be labeled as a three-wave move ABC. This is the main distinguishing factor between the two counts, the second being the next rise on the 14th.
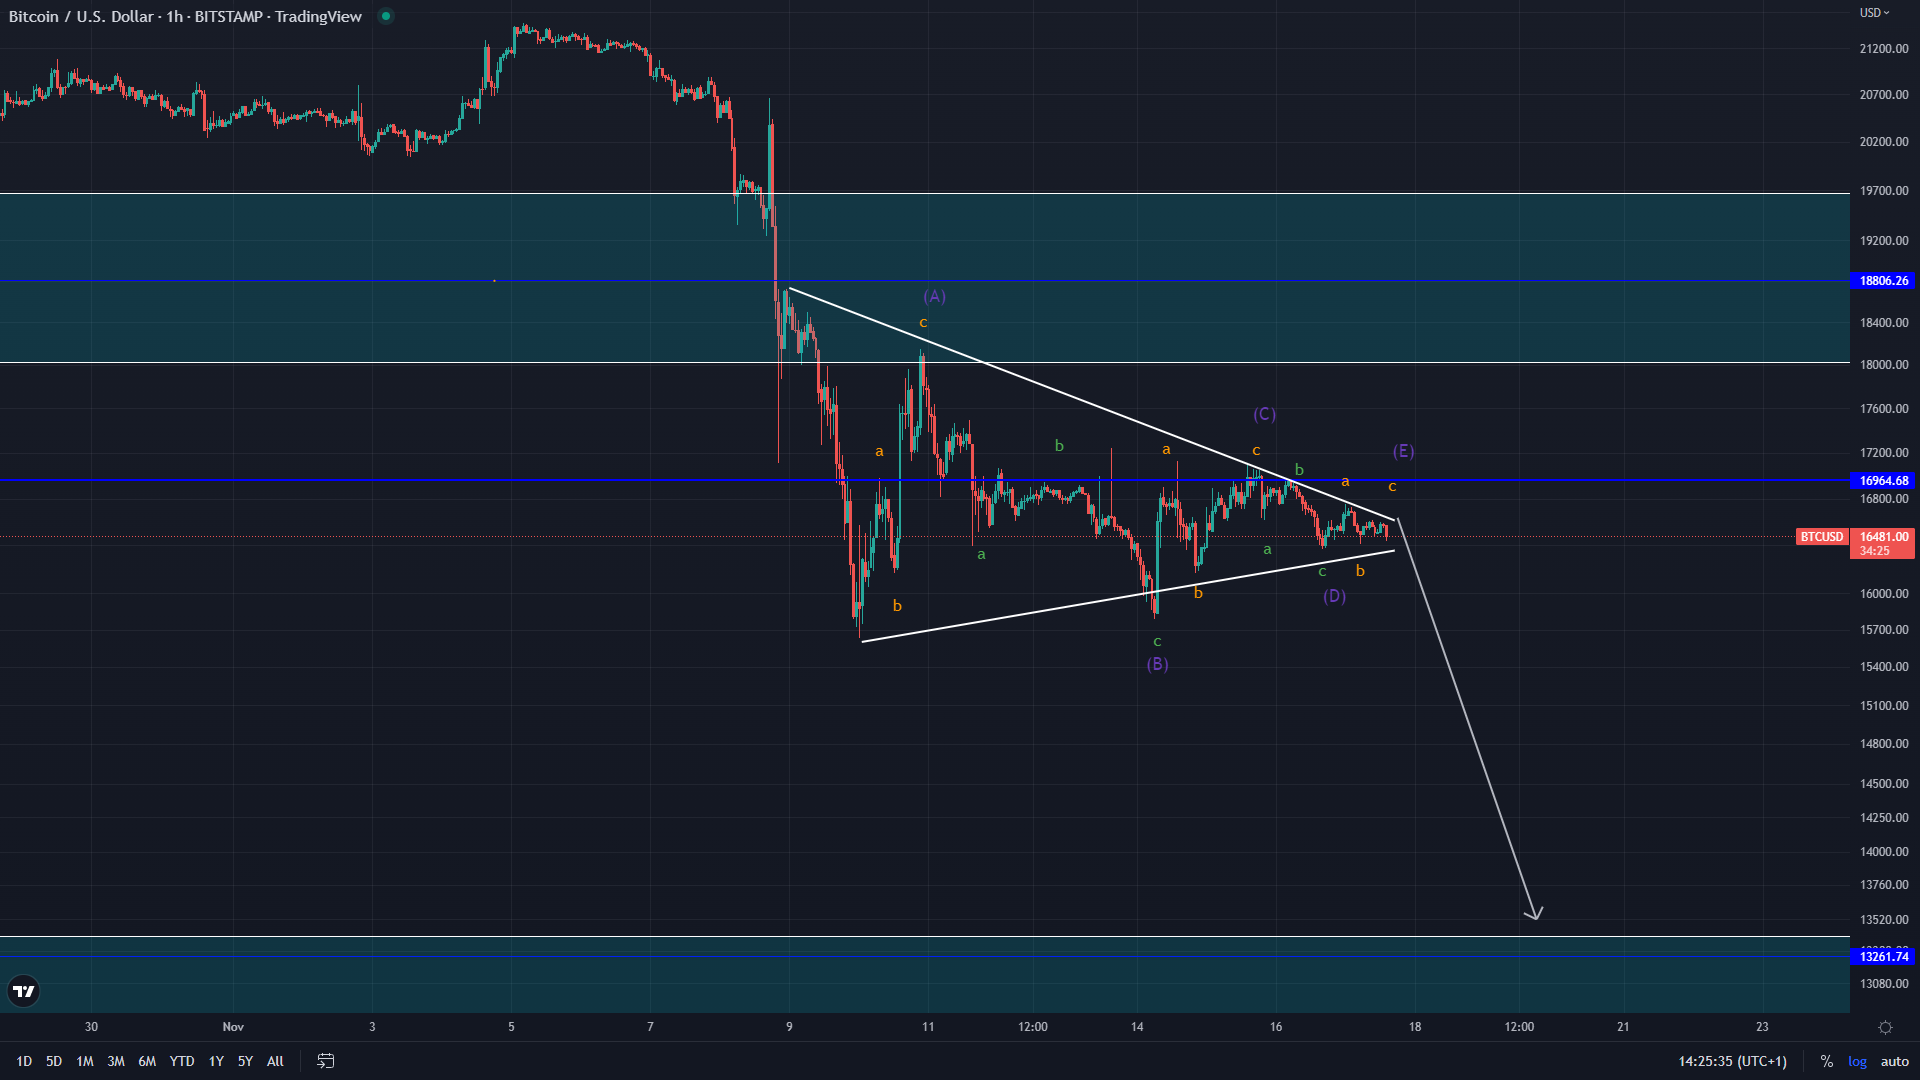
If this is the case, the symmetrical triangle is an ABCDE correction that now ended with another interaction with the triangle resistance. It is going to propel the price into a breakout to the downside immediately.
The price target would then be potentially the next support zone to the downside, which starts around $13,400 and ends at $12,500.
Which is More Likely?
Considering the fact that we are seeing a symmetrical triangle, it would be right to say that both possibilities carry the same likelihood. However, one can be interpreted as more likely having in mind the wave counts.
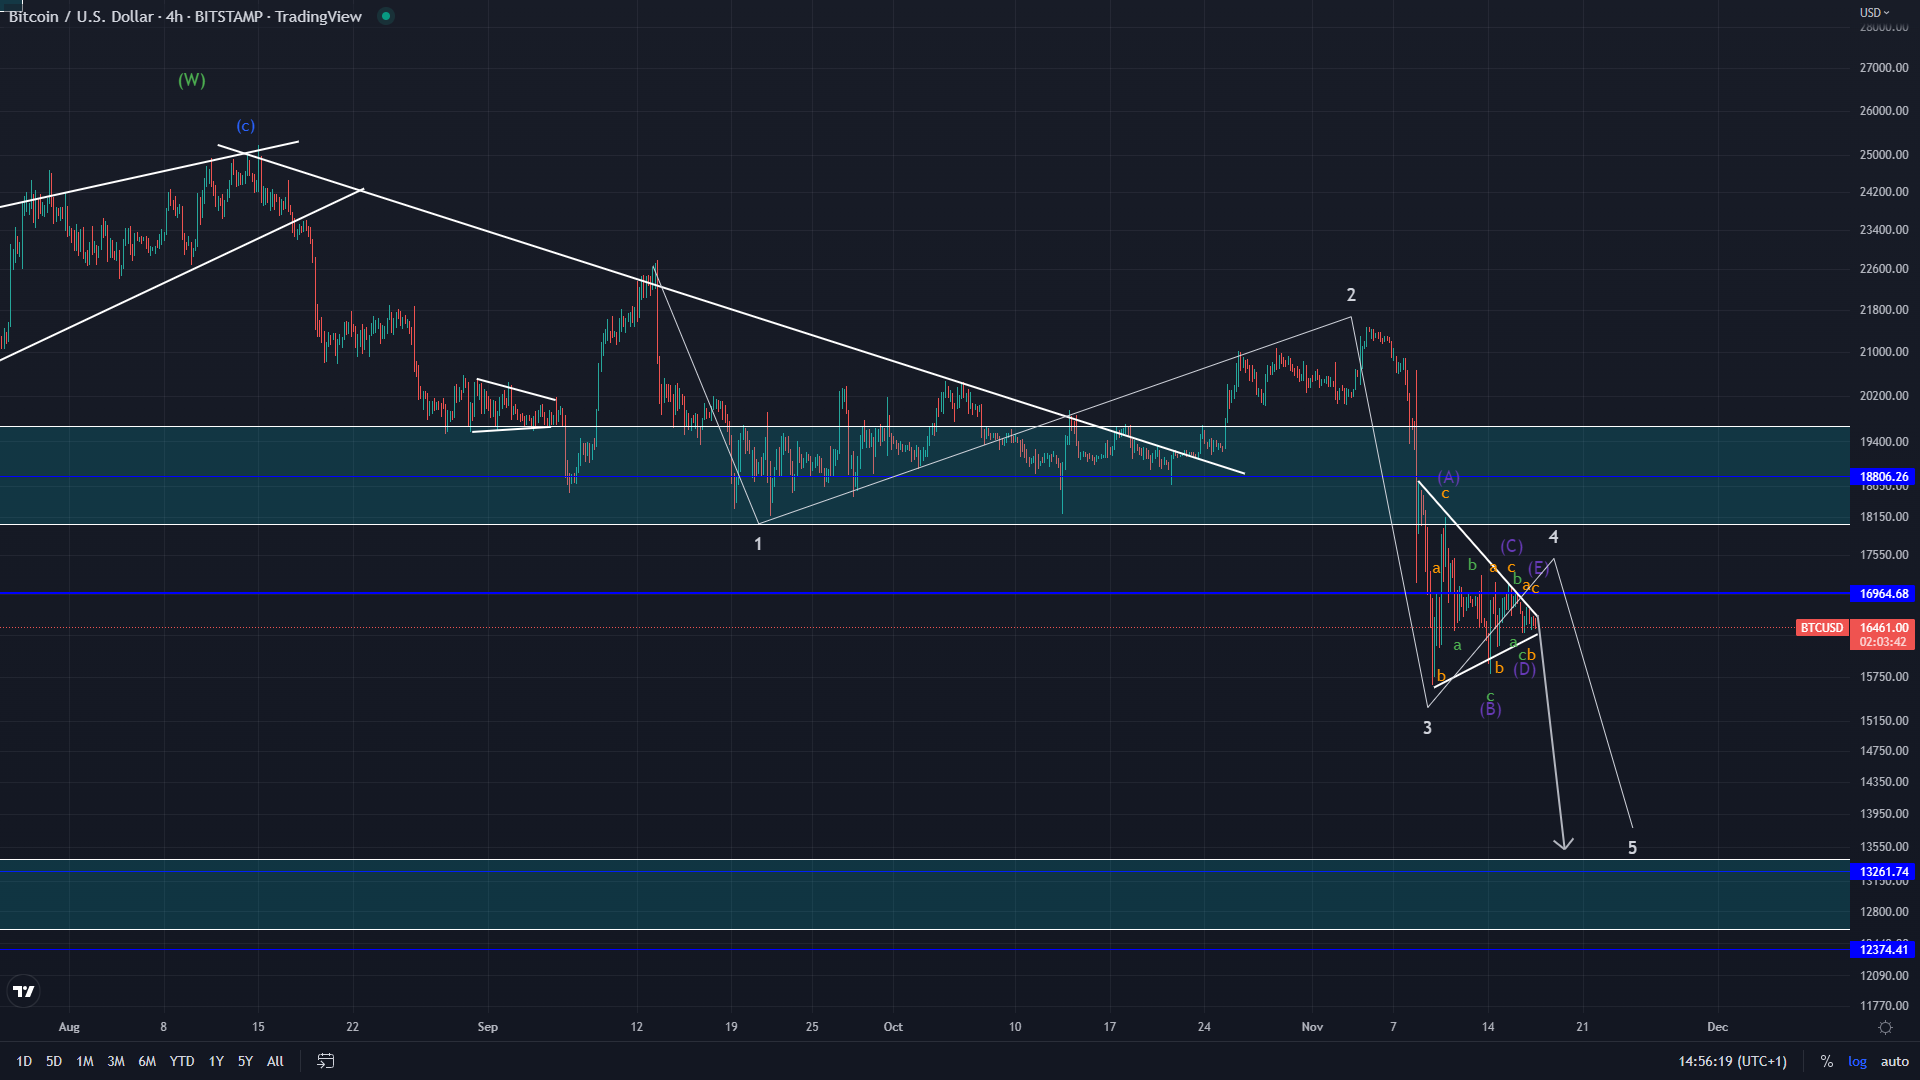
Most notably in a bearish count, the symmetrical triangle would indicate that an ABCDE correction is the fourth wave from the previous five-wave impulse to the downside, as ABCDE correction can only be found in the fourth wave.
Considering the rules of the Elliott Wave theory, we can only account for this presumed fourth inside the impulse wave that started on the 13th of September. This is highly unlikely, but not impossible. Just improbable, because as can be seen on the 4h chart above, the second wave and the fourth are not of the same degree. Especially considering the length and the fact that the fourth wave, if a sideways correction like an ABCDE, should last longer than the second wave.
Deducing the likelihood of the bearish count, by default makes the bullish count more likely.
Conclusion
The safest way to approach further action is to wait and see the breakout direction from the symmetrical triangle. In both counts, a breakout would be expected shortly with no further indecision looming over Bitcoin.
This is why a strong candle close above its support/resistance lines is going to provide the clearest signal of where the price is going to go in the upcoming period.
If we see a breakout to the upside, then the price target would be somewhere around $19,700. Such levels will set up the price for further potential upsides.
But if the price makes a breakout to the downside, then a downfall to $13,400-12,600 would be a potential zone in which it can find support next.
In a negative scenario, that would mean that we are headed further to full-on capitulation, close to what we have seen in November-December of 2018 when the price of Bitcoin fell from $6,000 to $3,200. In the terms of today’s prices, that could lead Bitcoin to fall back as low as $10,200.
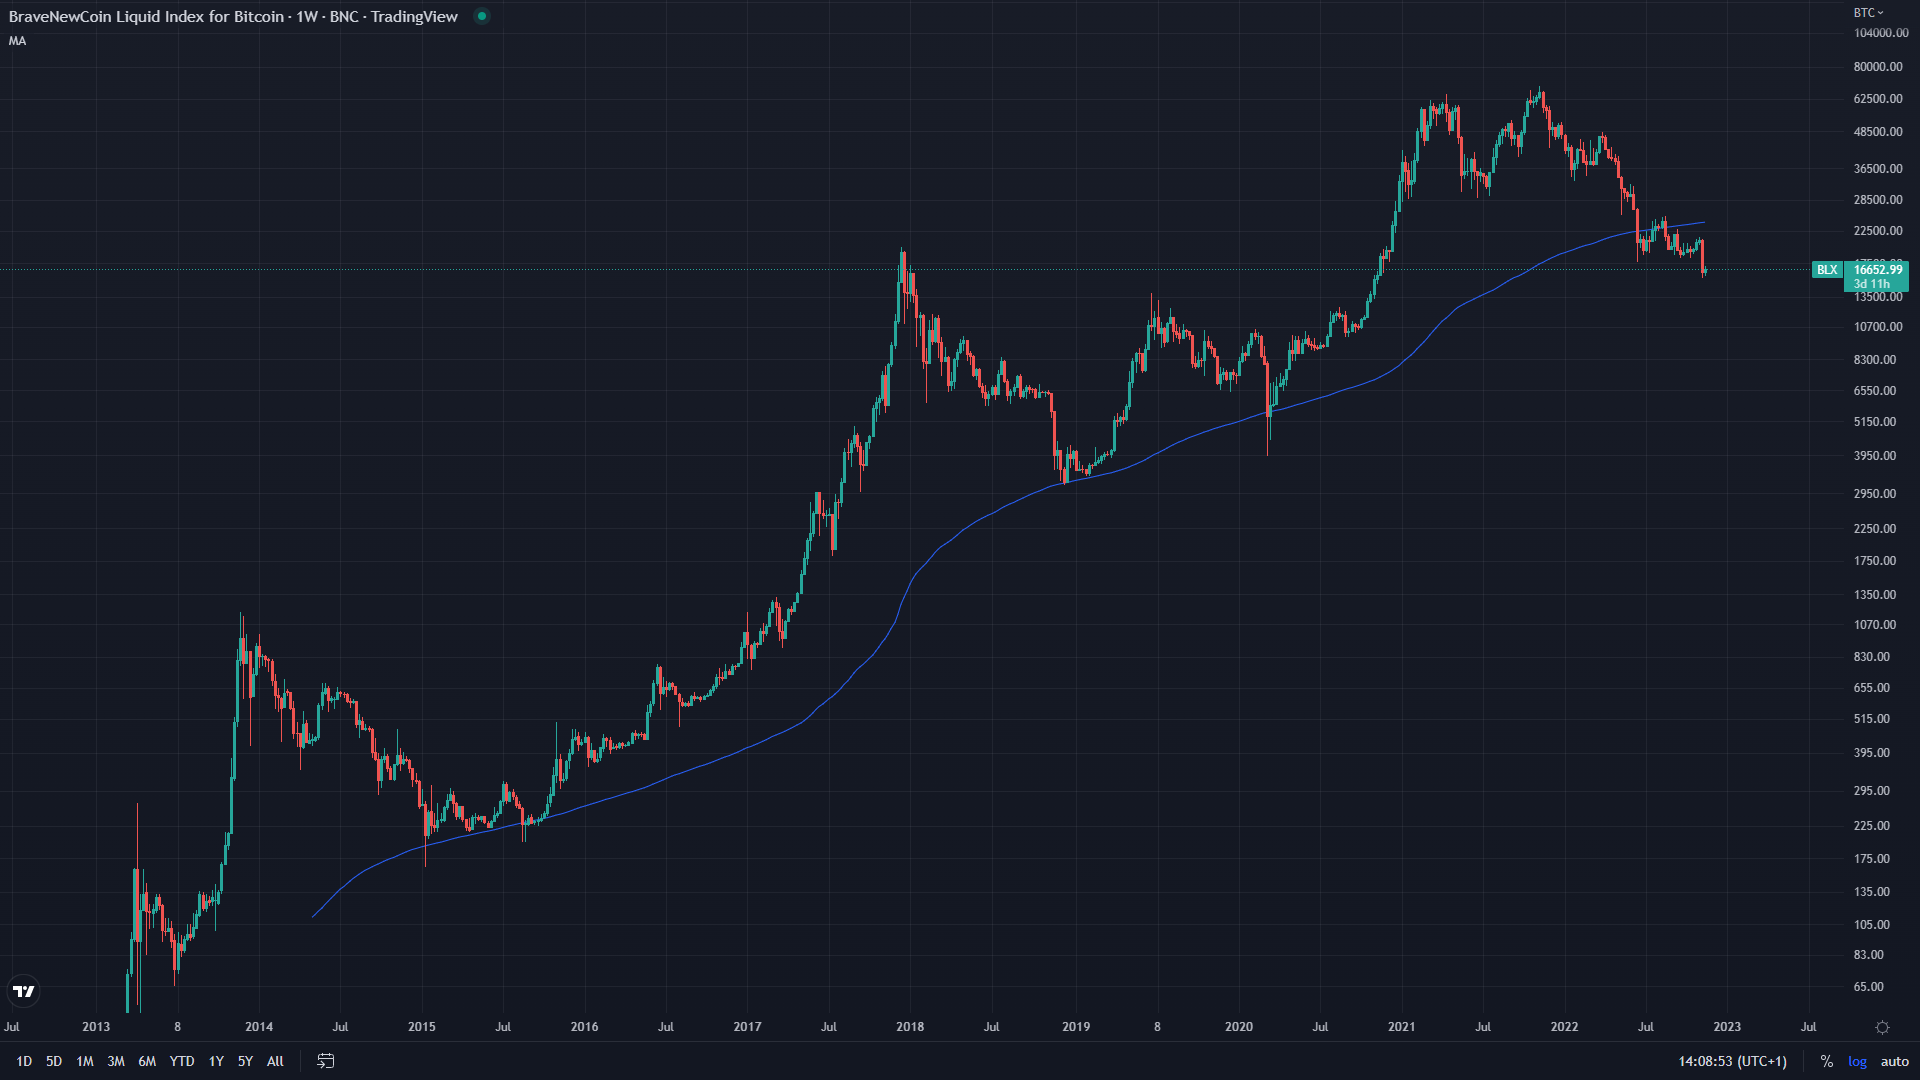
The scary fact is that for this whole period from June of 2022, the price of Bitcoin was trading below the 200 W moving average, which historically speaking provided guidance on a potential bottom zone, encompassing all the lows from 2014.
Now the price made a progression below it steadily. This is unlike the time it made wicks below it but ultimately respected it. This point outs that this bear market capitulation could be even worse than in the past.
