

- XRP rebounds following recent corrections, buoyed by stronger technical indicators and rising trading volumes.
- With a broader market revival, XRP could push higher, with targets around $2.80.
After a sharp December correction that followed a fivefold rally in November, Ripple (XRP) appears poised to regain its upward momentum.
The token has jumped over 10% in the last 24 hours, approaching a critical resistance level at $2.80. Should selling pressure return, $2 is a key support level to watch.
XRP Price Recovers
XRP has shown strong growth over the past week, driven by a sharp increase in trading activity and improving investor confidence.
Sponsored
Currently trading at $2.42, XRP has climbed to its highest level since December 18, 2024, reflecting a 19% rebound from its holiday season dip below $2.
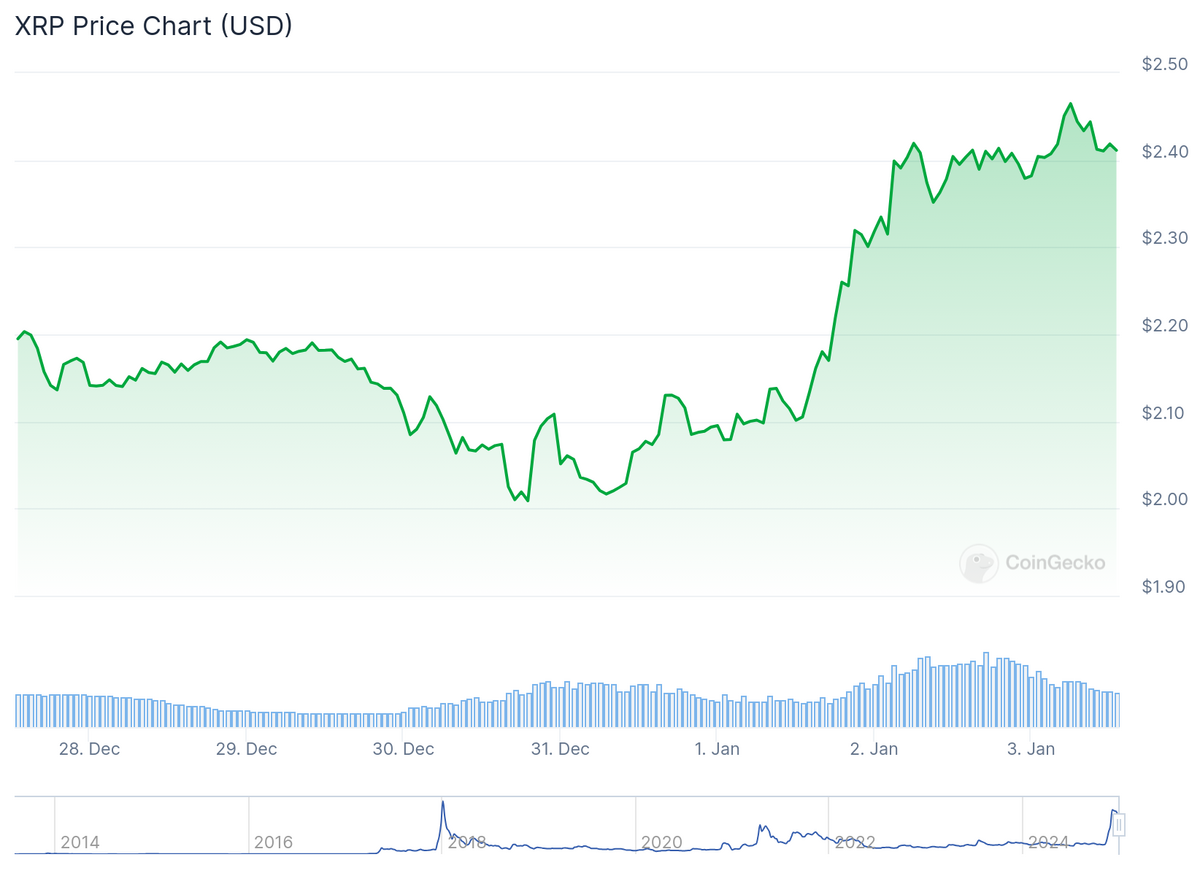
The rally mirrors a broader crypto market upswing, with Bitcoin breaking past $96,000, Ethereum topping $3,400, and Solana advancing 9.3%. The total cryptocurrency market capitalization has recovered above $3.5 trillion accordingly.
Driving XRP’s rise is a spike in 24-hour trading volumes, which soared to $5.4 billion, highlighting significant investor interest.
Meanwhile, Open Interest (OI) in XRP futures surged 19% to over $2.58 billion, marking its highest level since December 26 and underscoring heightened activity in derivatives markets.
The recent uptick in XRP may also be attributed to optimism surrounding the upcoming inauguration of President-elect Donald Trump and the expected appointment of crypto-friendly Paul Atkins to lead the SEC. Combined with rising trading volumes and Open Interest, this has fueled bullish sentiment, suggesting the potential for further gains in XRP.
Bullish Momentum Indicators
With buyers re-entering the market, momentum indicators show early signs of a potential XRP price shift back to a bullish trend.
MACD (Moving Average Convergence Divergence) on the daily chart is nearing a bullish crossover, suggesting that upward momentum could be building, and the price may soon begin to rise.

Additionally, the daily RSI (Relative Strength Index) has crossed above 50, signaling an increasing buying pressure that could drive further gains if momentum strengthens. However, the trading volume currently remains low.
Key Support and Resistance Levels
As of today, XRP’s daily chart highlights two critical levels. The $2.8 resistance is key for XRP to break through in order to maintain its upward momentum.
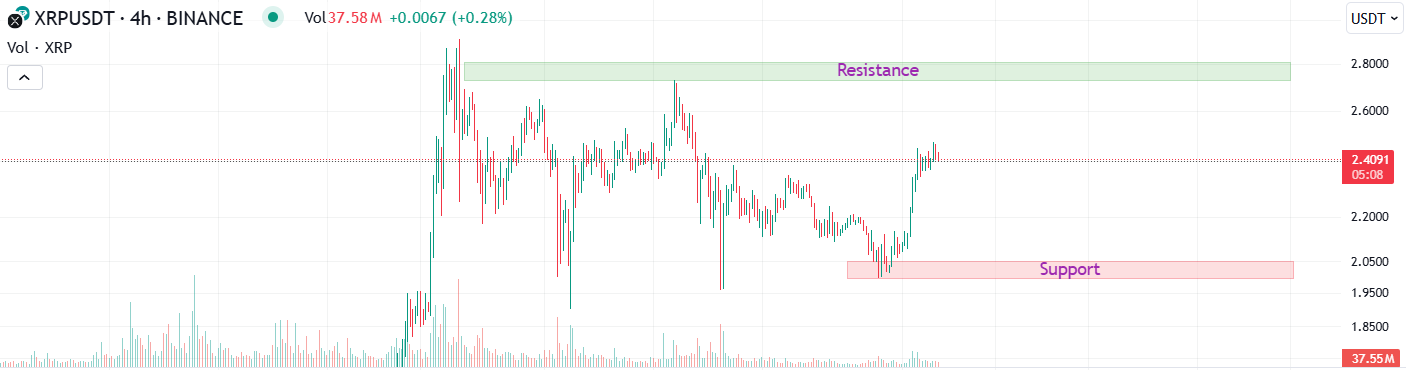
On the downside, the $2 support level is crucial if selling pressure returns, as a failure to do so could signal further declines.
Discover DailyCoin’s popular crypto news:
Ethereum ETFs Surge to Record Highs in December Inflows
MicroStrategy’s Stock Drops as Investor Confidence Wanes