

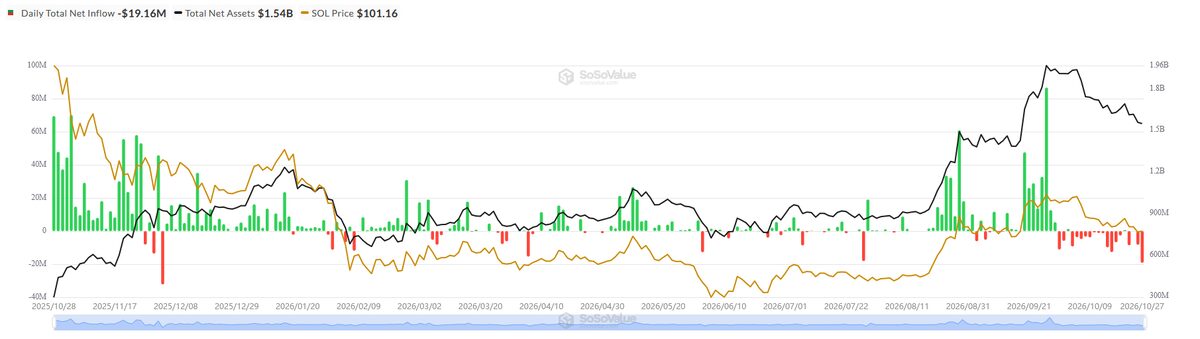
The Solana (SOL) based exchange-traded funds (ETFs) freshly registered a fourth consecutive week marked with multi-million outflows. October’s treatment has been brutal for most Solana ETFs, now slimming by nearly $100 million since the beginning of the month.
Dropping Wall Street’s Solana Balances Rattle Price
The latest balance adjustment came from Grayscale. Their ETF product runs under the GSOL ticker and just dumped $19.16 million, reducing their cumulative net assets to $153.04 million. This hardly matches with June, the only other month in the red, when Solana ETFs shrank by $787K.
Based on Solana’s moving-average ribbons & the Bollinger Bands, now the altcoin’s ability to stay above the $100 psychological level is a top priority. There’s the lower-tier Bollinger Band at $99.21, providing a demand zone that’s a few dollars above the mid-tier moving average ribbon.
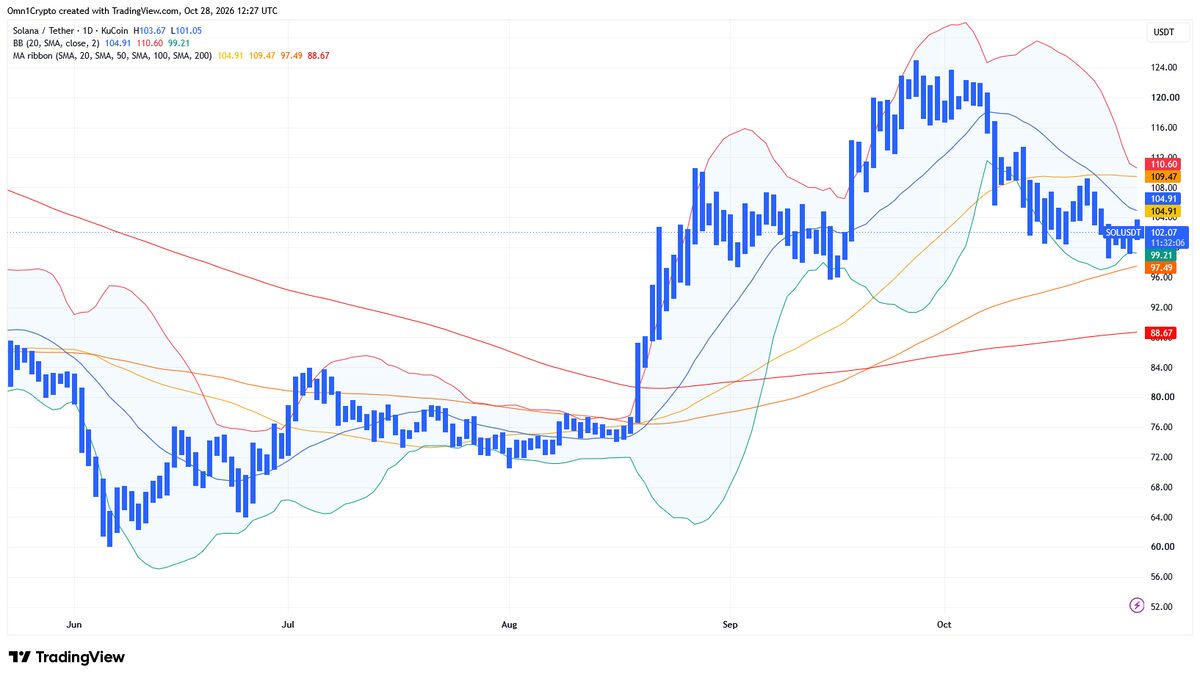
Now, Solana’s (SOL) bulls will be looking to conquer the mid-tier Bollinger Band (BOLL) at roughly $104.89, before taking off to $110: this Solana price range confirms a bullish trend reversal that has previously served as a support floor in Solana’s rallies towards $250 – $260. The main question remains whether SOL can conquer the bouquet of upper moving averages.
Elliott Wave Count Uncovers The Most-Sensitive Level
If reliable footing is established above $110 on the daily charts, Solana’s (SOL) way towards $155 is met with a couple of confluent resistance clusters, particularly at $125 and $135. MCO Global Research places a swing low at $98.62. The firm thinks a new low would add evidence for further downside, while a move above the $110 resistance would undo its bearish count.
The Elliott Wave-based Solana price chart analysis concludes that a sustained move above $109.20 would draw immediate bullish power to contest the upper confluent resistances.
Until that manifests on the charts, MCO Global Research said the more likely Elliott Wave move is a downwards 1-2 count with a new low below $98.62 adding fuel to the bearish near-term bid.
Dive into DailyCoin’s popular crypto news today:
Cardano’s $5 Million Copper Bid Faces Huge Price Obstacle
$1.8 Trillion Franklin Templeton Files for Two ETFs Linking Stocks and Bitcoin