Non-fungible tokens (NFTs), especially metaverse-related NFTs, enjoyed a strong and swift period of growth during the first quarter of 2022, especially when compared with their counterparts in the space, cryptocurrencies, claims blockchain analysis firm Nansen.
In its recent ‘NFT Indexes Quarterly Report’, Nansen experts revealed that the NFT market had witnessed 49.9% price growth in Q1, while the Bitcoin-tracking index had increased by just 1.9% in the same period.
Meanwhile, ‘Ether’, ‘Large Cap Crypto’, and DeFi-related indices appeared to be languishing in negative growth territory.
(2/5) Performance of NFT market and other assets pic.twitter.com/vVQV3baXcD
— NansΞn🧭 (@nansen_ai) April 12, 2022
The NFT market outperformed the cryptocurrency market year-to-date with a 49.9% return when denominated in ETH, and 37.7% when denominated in USD, said the company. The total market capitalization of Nansen’s ‘NFT-500 Index’ is around 6.16M ETH, or $18.6B USD.
Sponsored
Nansen’s broad ‘NFT-500:ETH Index’ tracks the performance of the leading 500 NFT collections on the Ethereum network. The company recently rebalanced this and 5 smaller NFT indexes that track blue-chip, social, gaming, art and metaverse NFTs.
The Biggest Returns Were From Metaverse NFTs
As Nansen’s data revealed, Metaverse NFTs led the market in Q1 2022 by generating up to returns of 130.9%, denominated in ETH, or 112% when denominated in USD.
Sponsored
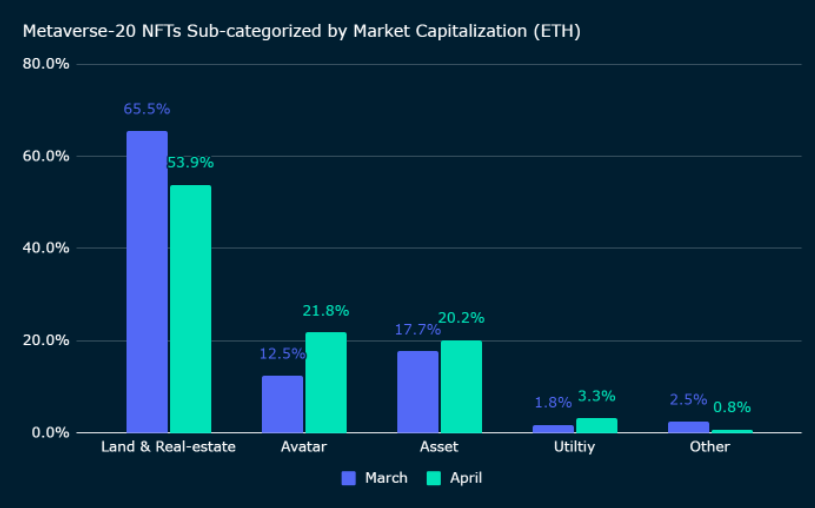
The company also noted a slight decline in the land and real-estate NFT subcategories following the ‘Metaverse-20 Index’ rebalance. In the same period, the general performance of metaverse avatars and utility NFTs has increased.

Despite their growth, Metaverse NFTs were highlighted as the most volatile NFT market segment. Nansen equates this to the price of asset-typed Metaverse NFTs, such as The Sandbox’s ASSETS, says Nansen.
“Given the diverse range and types of Metaverse Asset NFTs, evaluating the prices of these NFTs is challenging. Similarly, the relative illiquid nature of Art NFTs also lead to asymmetric price information within the market, which could be a contributing factor to its volatility. As a result, evaluating these NFTs can sometimes present a wicked problem, especially those pieces that are rare. Many of these market participants, thus, behave as speculators,” the researchers explained.
(4/5) Metaverse NFTs led the market during Q1 2022, tracking a year-to-date performance of 130.9% when denominated in ETH and 112% when denominated in USD pic.twitter.com/bgZDHfZfte
— NansΞn🧭 (@nansen_ai) April 12, 2022
When indicating the least volatile NFTs, the researchers mentioned non-fungible tokens addressed to its ‘Blue Chip-10 index’, which tracks a collection of 10 widely recognised and well-established NFTs.
Game NFTs Performed the Worst
Nansen’s ‘Gaming-50 Index’ displayed the biggest decline in performance during the first quarter. When compared to other NFT indexes, gaming NFTs generated losses of up to 24.4%, denominated in ETH, or 30.6% in USD.
The ‘Gaming-50 Index’ tracks the 50 biggest gaming NFTs by market capitalization, including Play-to-Earn games NFTs, Game-Fi (gaming with Decentralized Finance elements) NFTs, and role-playing game NFTs.
