
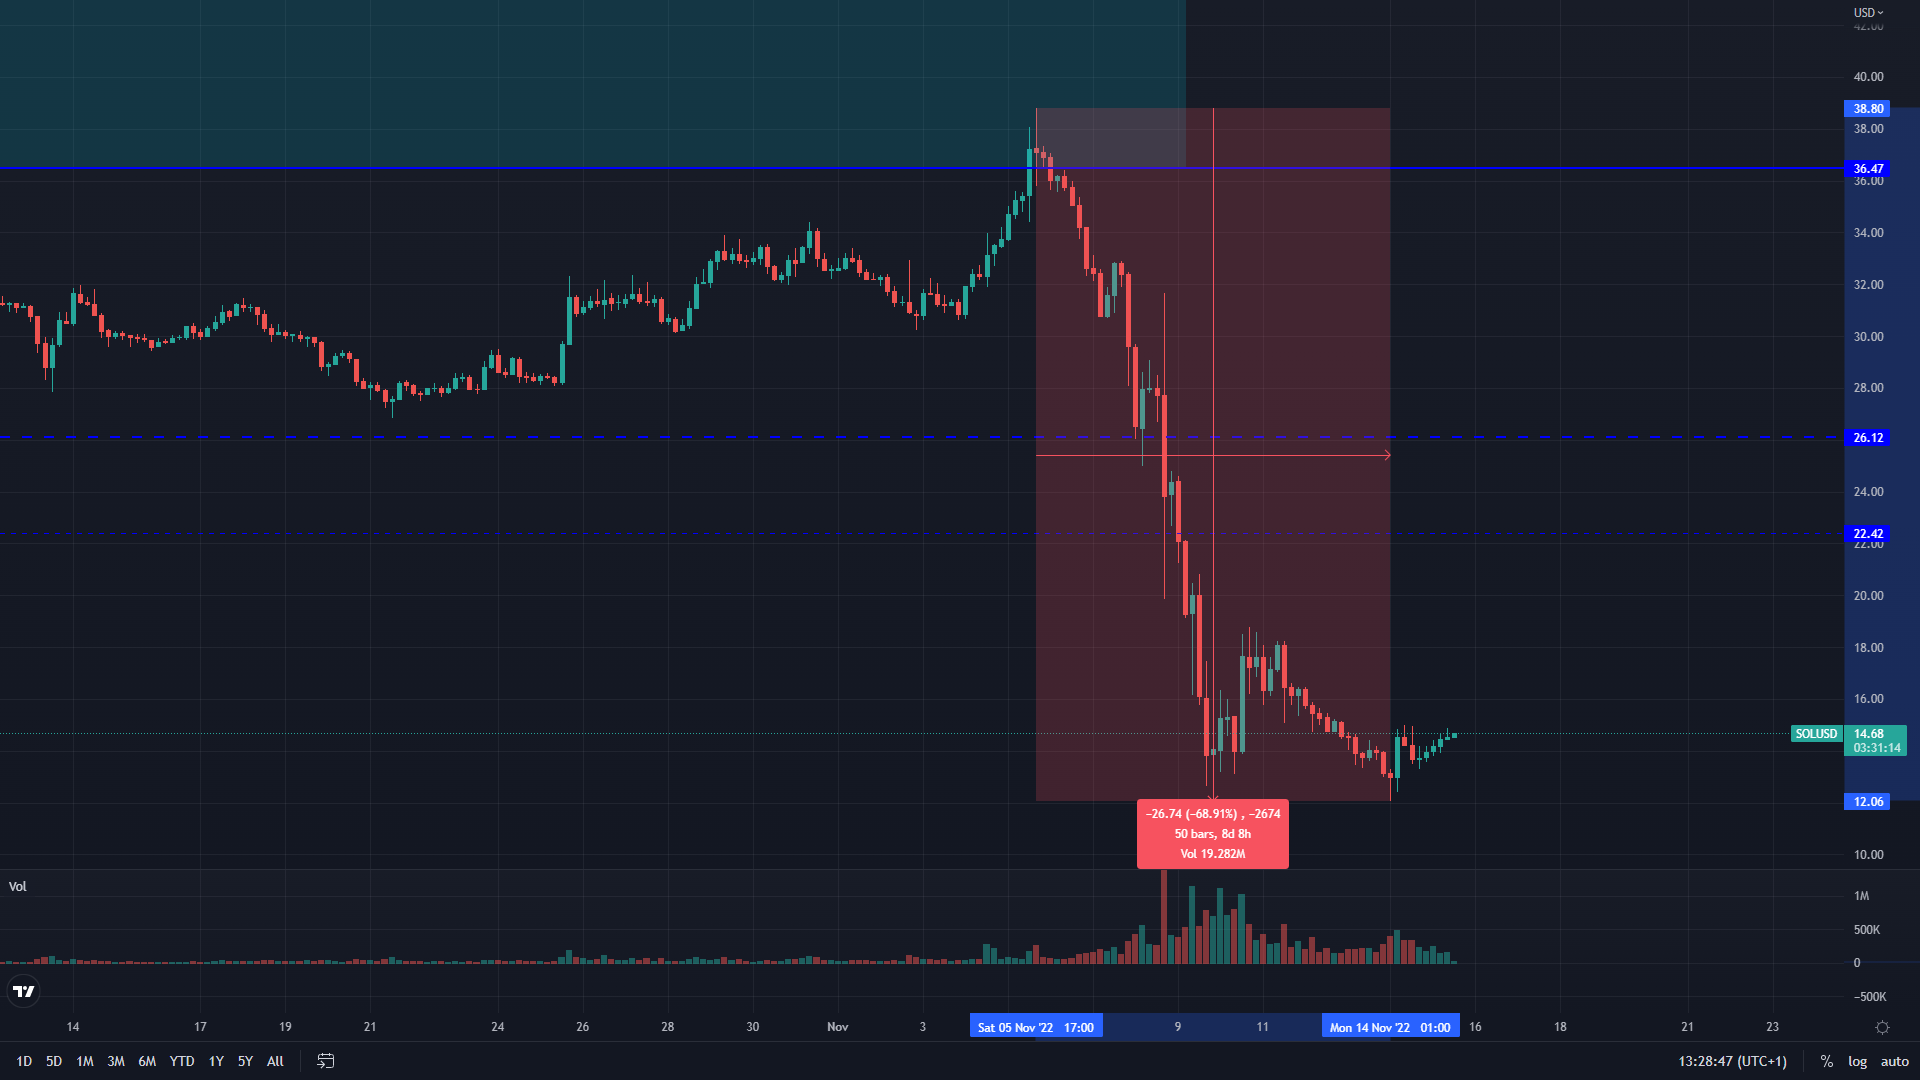
From the 5th of November, the price of Solana (SOL) fell by 68.91% measured to its lowest point on the 9th at $12.3. This low was tested again yesterday, and the price made a minor bounce. We are left with the question – can we see a bigger recovery from here?
Looking at the volume indicator, we see that there was a significant cluster forming around the 9th’s low. A bounce occurred after this. But now after the low on the 14th, the volume doesn’t support the holdup.
Sponsored
Either way, at least for now this can be a local low that can set up the price for a corrective recovery of minor momentum.
“When in Doubt – Zoom Out”
Solana had a great run for many months. It started off at $0.23 in April 2020 and from there started developing an uptrend that lasted 574 days. Eventually, it increased to $258 at its highest peak on the 6th of November 2021.
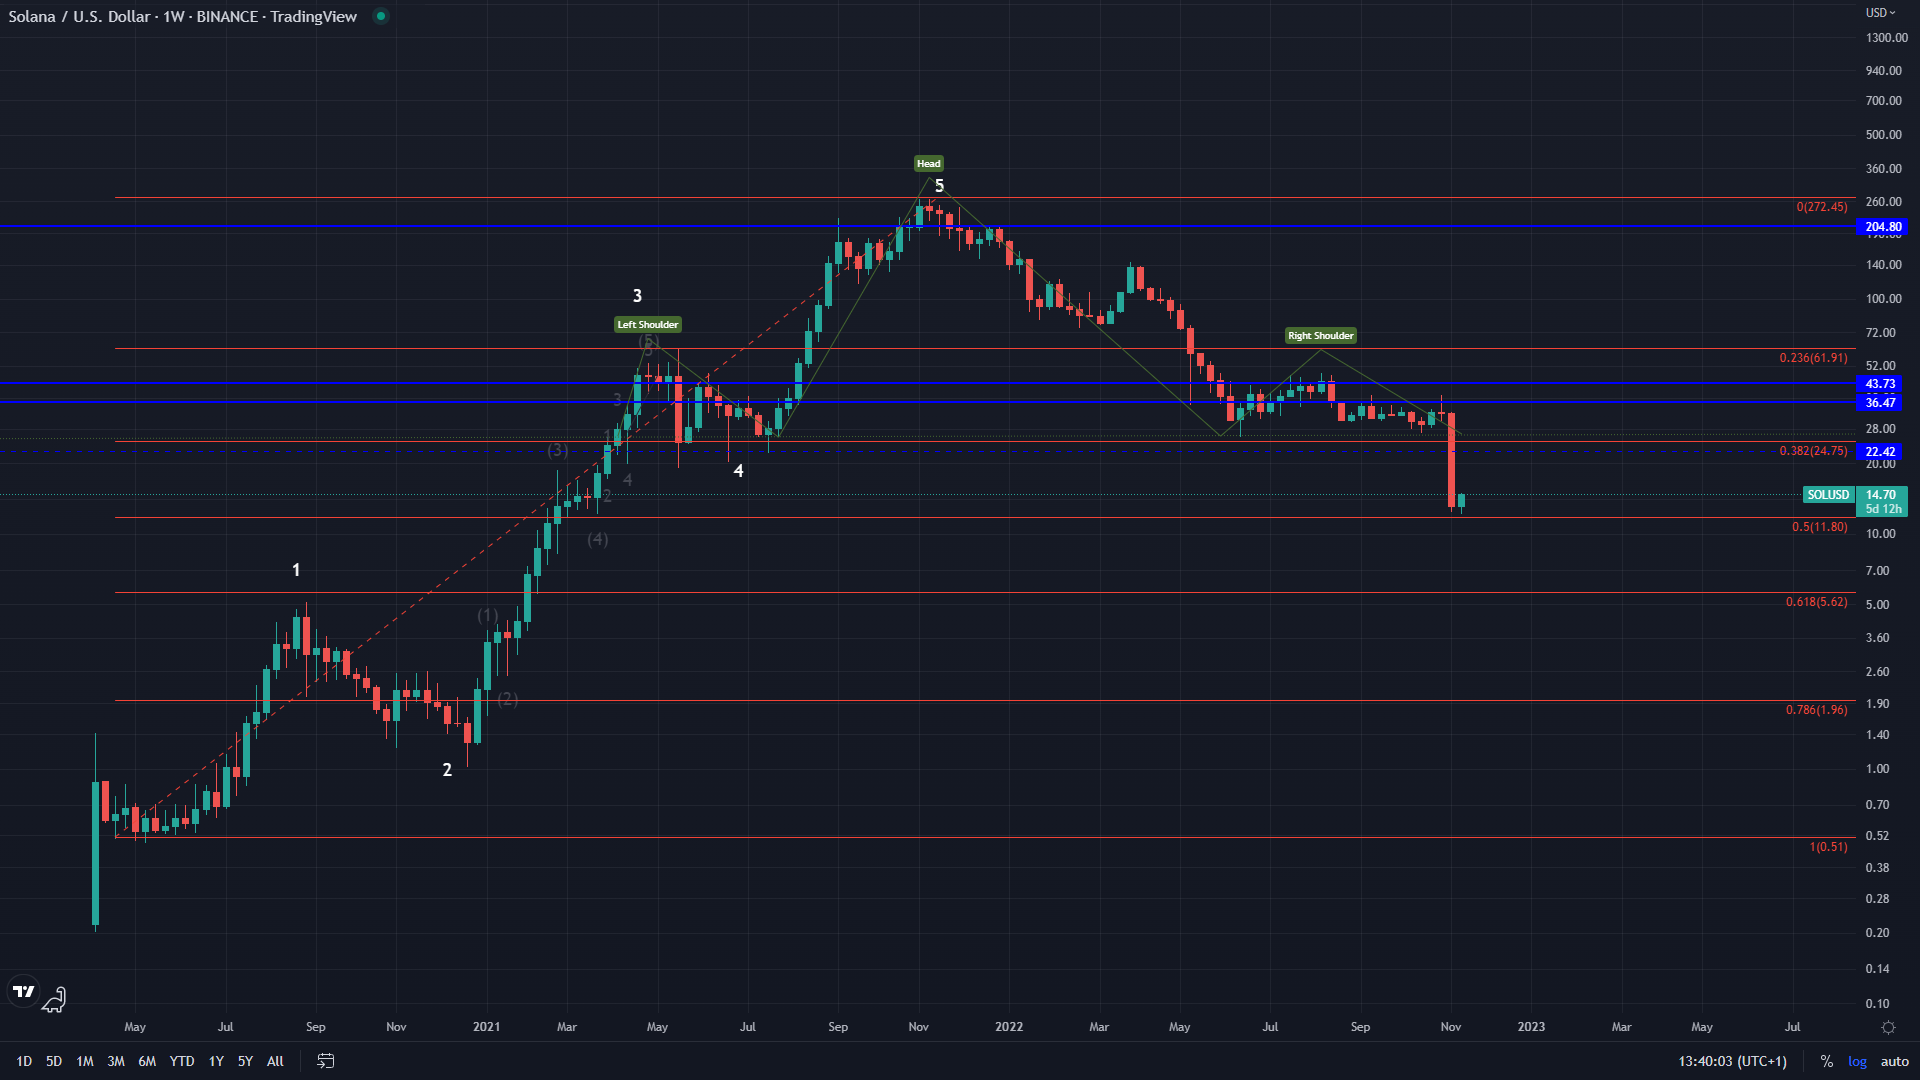
What’s interesting is that Solana, like the general market, underwent a correction from May 2021 to July. But it actually ended up continuing this upward movement for longer. Meanwhile, the majority of altcoins made a lower high in November last year.
Bitcoin and Ethereum reached new highs from Jul 20th of 2021, but only by a small amount. On the other hand, Solana made another tenfold increase from there. The coin went from $22 to its all-time high of $258.
Sponsored
On the weekly chart above we observe that this was the first five-wave impulse of the highest degree. This was the first impulse wave in its price development, meaning that a correction should take place after for the second wave to the downside. But considering its price increase at the time, the majority of investors eyed the significant $22 zone as a potential end of the downtrend from November 2021.
June 18th was a significant date across the market, as the price started showing a potential reversal point. It had the potential to market the completion of the bear market. This was the case with Solana as well, and with the $22 zone making a bounce, it started looking positive.
Further Observations
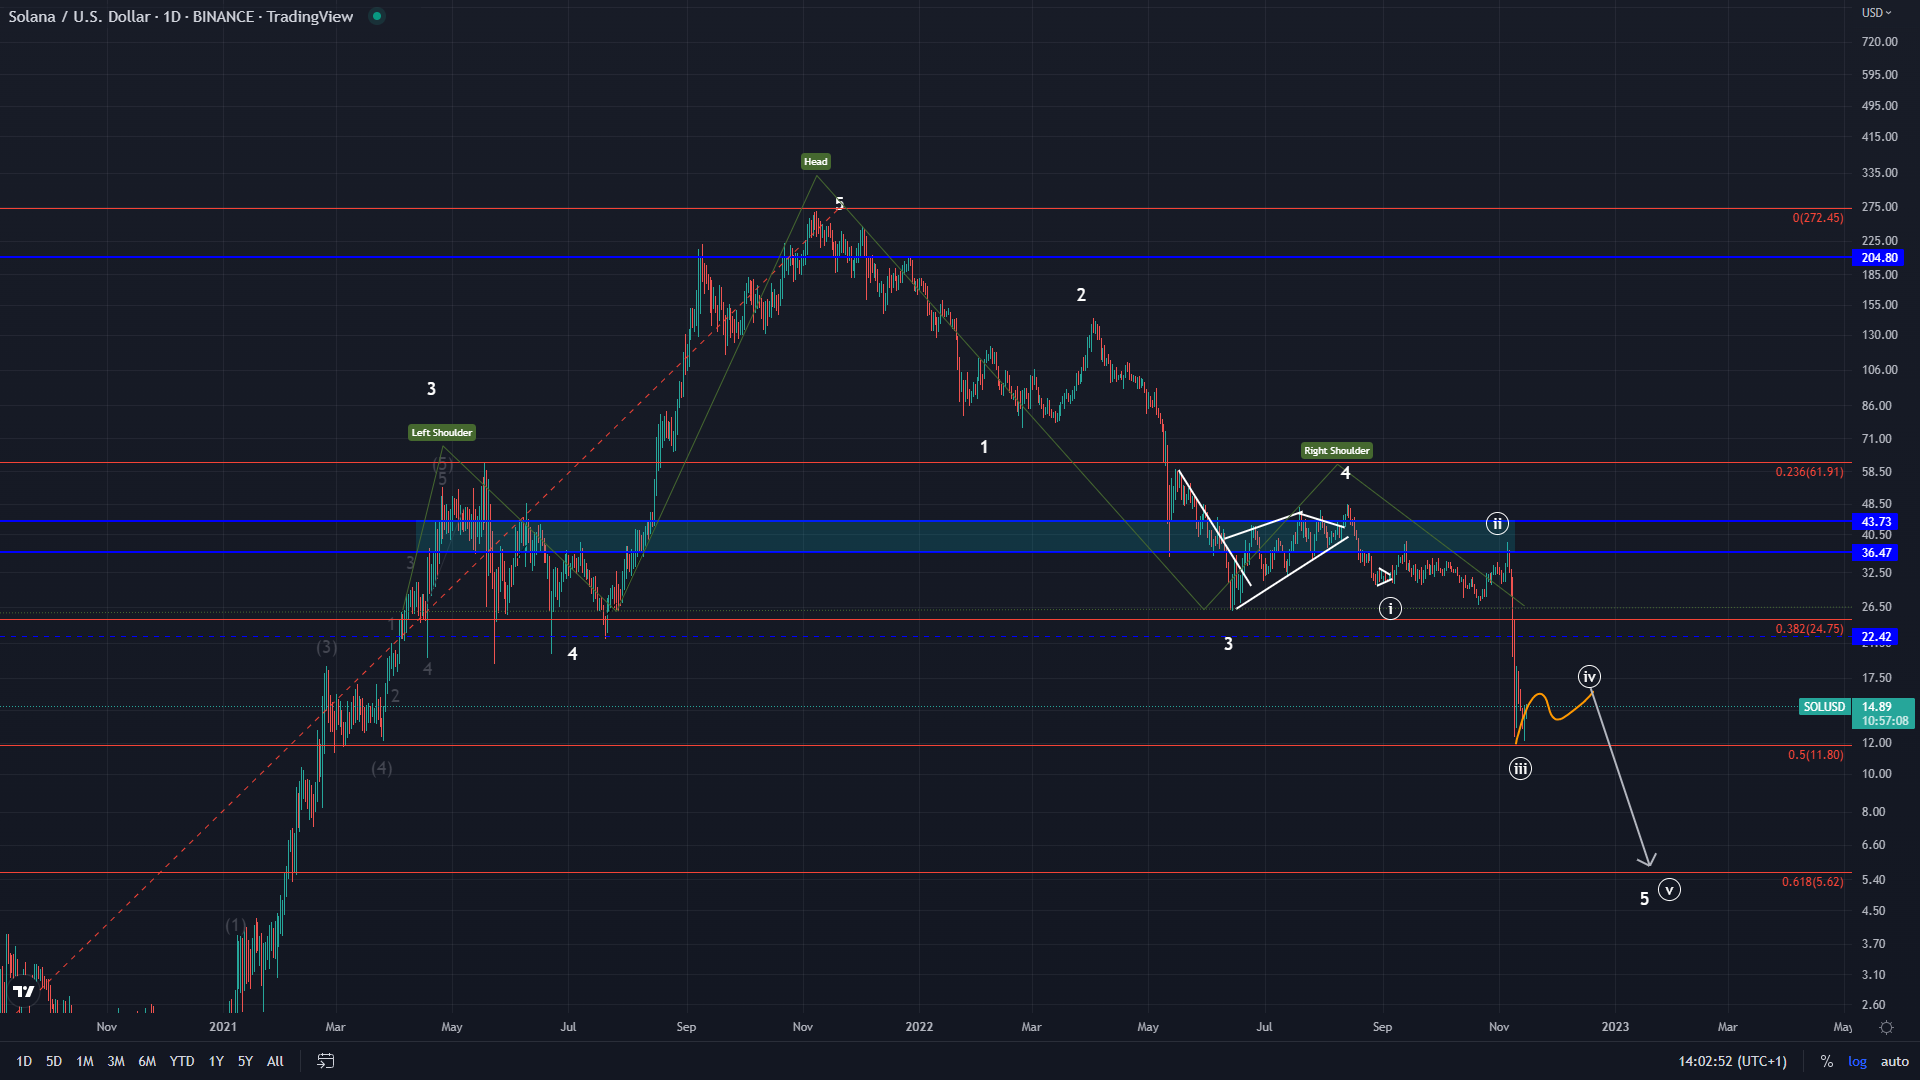
On the daily chart above, we see that the price of Solana struggled to keep up the upward trajectory and make it past the $45 resistance zone. In conjunction with the previous corrective structure from May 2021 to July 2021, this was actually a head-and-shoulders pattern. This left the price with more downside potential.
The 14th of August was the tipping point across the market as the prices were sent into another downward spiral. This was the case for Solana as well. We count from the rejection at the $45 zone as another five-wave move to the downside of the lower degree count which is the ending 5 wave of the higher degree one (Minute). Another lower low is thus expected to play out.
Where Can the Bottom Be?
This whole context that we have covered from the beginning of the price progression is important for figuring out a potential price target for the end of this decline.
According to the Elliott Wave, the most optimal target for the second wave after the first ends is the 0.618 Fib retracement level.
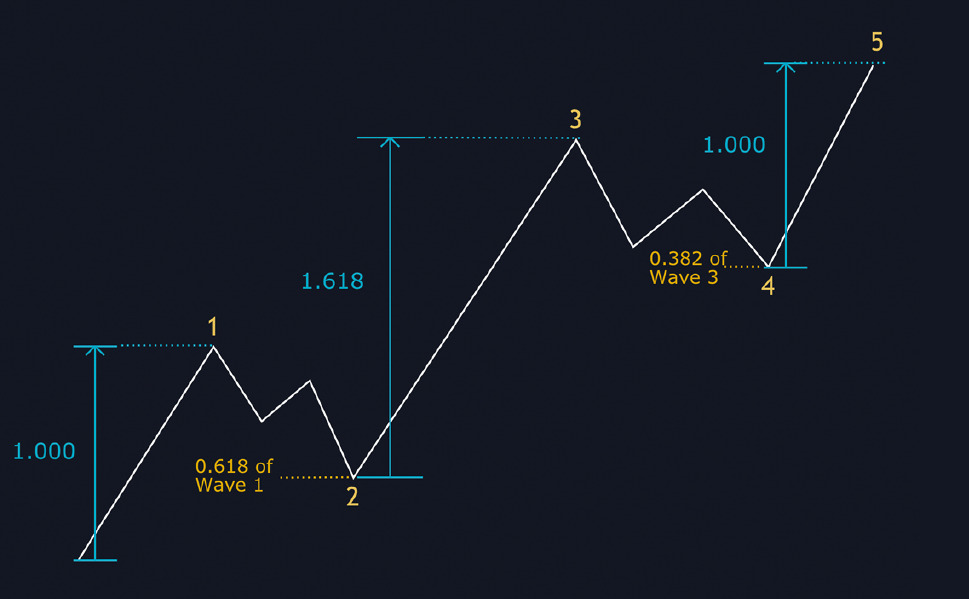
If the decrease from the 6th of November 2021 was the second wave of the intermediate count, then we come up with a price target of around $5 for its completion. This is also supported by the currently developing price action. We came to the 0.5 Fib level with a lower low expected.
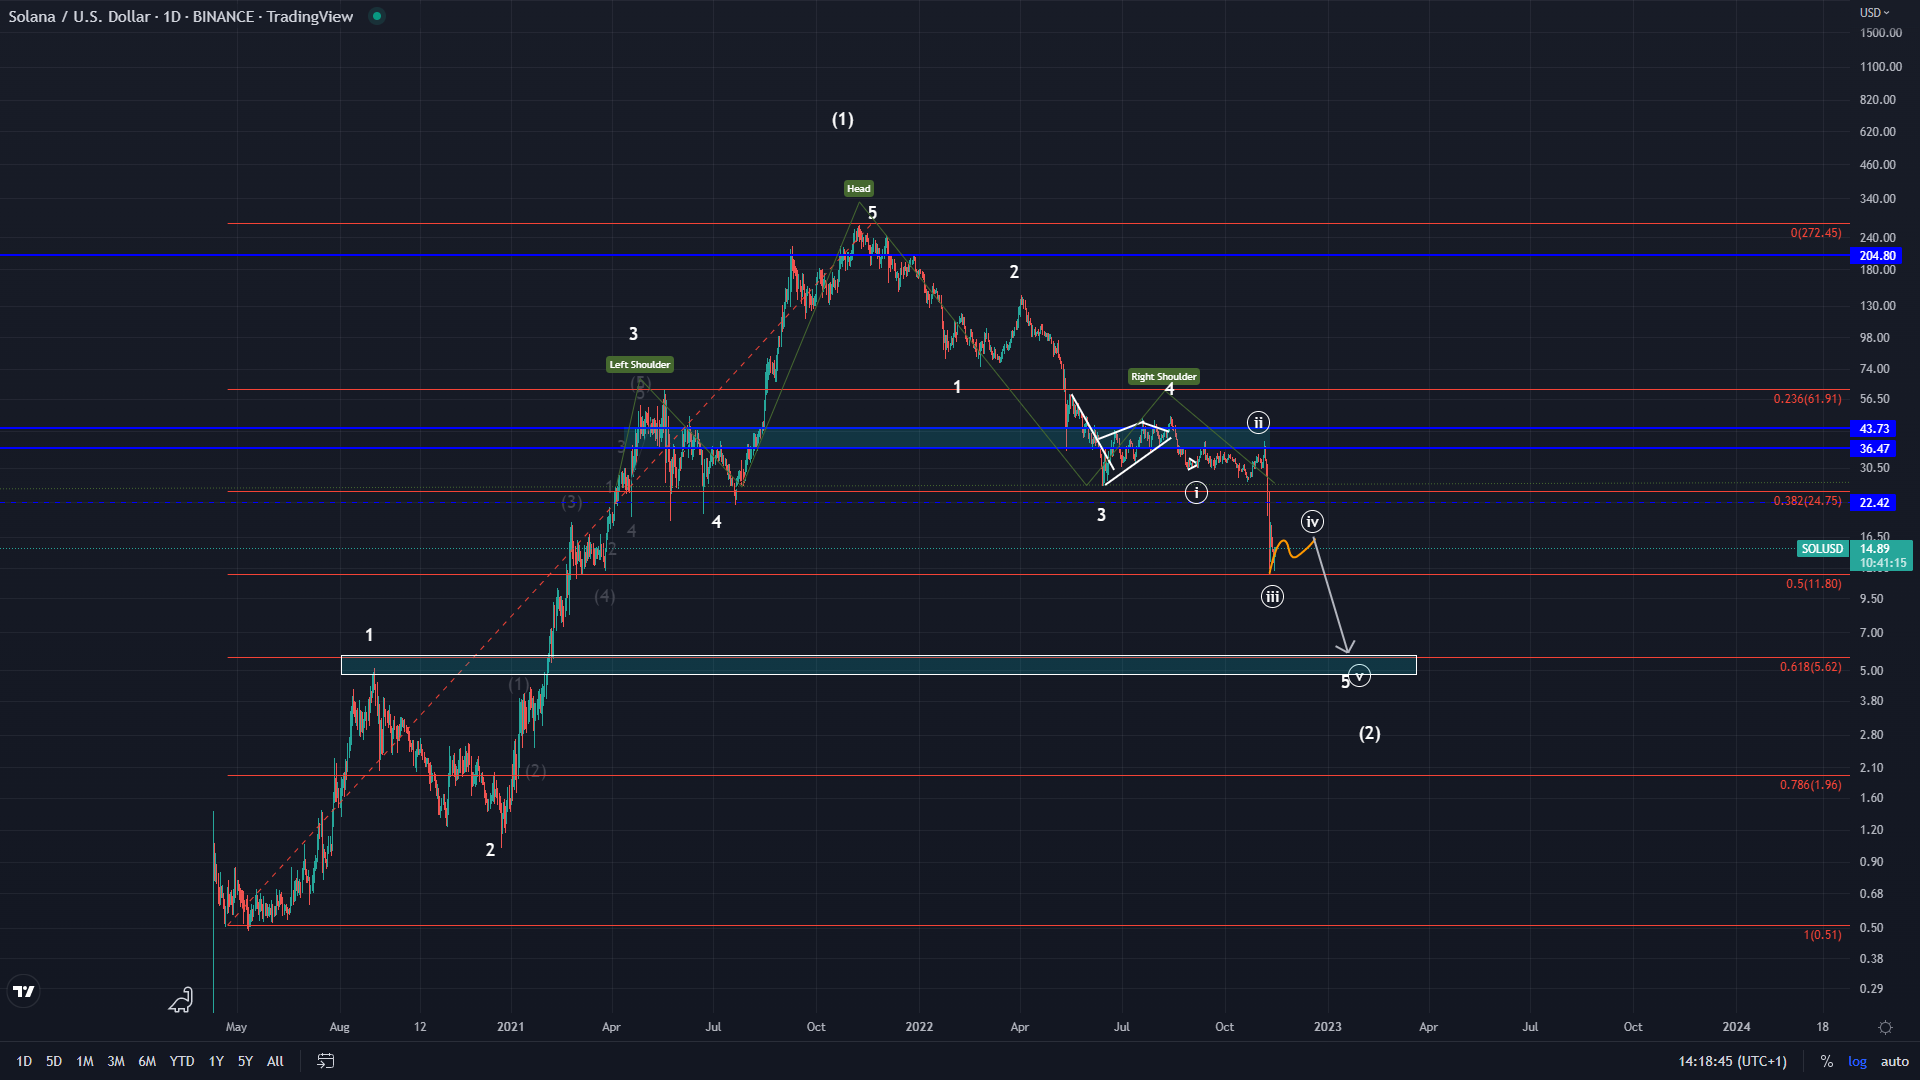
The 0.5 Fib level corresponds with a minor support zone, formed from February to March of 2021. It isn’t significant enough to support the price entirely. Additionally, it can cause a bounce that will be corrective in nature. This is a textbook fourth wave of the minute degree position, which usually makes the price move laterally and consolidate. This is why this area wouldn’t be expected to hold for much longer. It can only lead to a small relief before finally continuing for another leg down.
Final Thoughts
Finally, there are different counts and alternative possibilities which we will not cover here. The most notable thing is that the second wave correction cannot be a five-wave move according to the Elliott Wave theory. This brings us to think that the downfall from the 6th of November is not a corrective wave. Nor will this correction play out much stronger and set up a multi-year price with ultimately lower targets.
What’s important for now is that another leg down can be expected from the current levels. This could play out in the coming months. As the price progression continues, and if the price reaches the target and develops in the projected manner, we will discuss the most likely future outcomes.
