
One way or another, crude oil finds its way into conversations where you would least expect it. It’s never too far away from the picture when it comes to rate decisions, CPI prints, currency moves, and recession forecasts. That isn’t because energy analysts have an undue influence in macro discussions. It’s because oil is built right in the cost structure of the global economy, unlike most other commodities. Everything from transport to manufacturing, agriculture to logistics, gets affected by the price of crude.
Oil as a Continuous Economic Signal
The majority of macro information comes with a time lag. As soon as the GDP numbers are available, the quarter they are for is already behind us. CPI is compiled over a period of weeks. PMI needs to be combined from hundreds of survey responses. By contrast, oil prices reprice in real time, soaking up fresh data on global demand and supply, geopolitics, and currency fluctuations in the minutest of details within minutes.
It’s that immediate nature that makes the oil price chart worthy of watching, not just for its energy-specific information. It’s far from a perfect macro indicator, which is true for all indicators, but it has pretty much a wealth of information in it, which is difficult to find in any other continuous data stream. It can often be a first indicator of a trend that is only reflected in the official statistics weeks or months later and can at the same time confirm or contradict signals received from other sectors of the market.
There are two main benchmark forms in which crude oil is traded:
- West Texas Intermediate (WTI) – the US domestic benchmark that is stored at Cushing, Oklahoma, which is especially sensitive to domestic pipeline capacity and storage levels;
- Brent Crude – the international benchmark, which is used to price about two-thirds of the world’s traded oil and is generally a more stable indicator of the overall situation between oil supply and demand.
Another educational value is the difference between the two benchmarks. When it materializes, it’s typically a sign of regional infrastructure and logistic restrictions, not of divergence in the global demand fundamentals, which may be overlooked in the headlines.

Understanding the Relationship Between Oil Prices and Inflation
Energy does not all appear in the inflation figures as one item. It operates through the cost structure of almost every productive sector, which is why oil price moves tend to have repercussions that go beyond any energy component of a CPI.
Direct Contributions to Headline CPI
The energy component of headline CPI in the United States has been about 6% to 8% of the overall CPI basket in recent years, which is subject to fluctuations as prices change. When oil moves sharply, that weight is sufficient to move monthly readings around a bit. The deflationary effect of energy was very noticeable through 2023 as the base effects from an energy price surge in 2022 were playing off against high levels of services inflation and made it difficult to interpret the underlying pressures on prices.
The figure that central banks are more likely to target is core inflation, which excludes energy and food. However, that doesn’t imply they disregard energy. Eventually (and that means at some point and not necessarily a short one), increases in crude prices trickle down to the core components, especially in transport and distribution, and that’s where policy debates become trickier.
Second-Round Effects and Cost Pass-Through
The more persistent transmission channel is the one that has a longer time to materialise. Fuel and transport intensive industries react to high energy prices when they last long enough. This can then lead to wage pressures in energy intensive sectors. The effects of input costs cascade to sectors, which at first glance, would not appear to have a lot to do with crude oil.
In April 2025, the IMF World Economic Outlook identified persistent uncertainties over energy prices as one of the key upside risks to global inflation, and the second-round pass-through of energy prices is not easy to forecast in a world where both supply-side and demand-side pressures are active. That is what the 2022-2024 cycle empirically showed: the pass-through is real, but it is not easy to modelfully separate the timing and extent of the pass-through.
Supply Shocks and Demand-Driven Moves
Changes in the price of oil have varying effects. The increase is demand-led, albeit with a logical macro underpinning, with improved global activity. The increase due to a supply shock, by contrast, pushes prices higher without any demand-side growth to offset the inflationary impact. Shrunken output, OPEC+ conferences, and sanctions are not indicators of economic power.
The first step for any central bank is the diagnosis, but history indicates that central banks, unlike doctors, sometimes don’t make the diagnosis correctly the first time around.
Interest Rate Policy and Oil Markets: A Two-Way Relationship
Both monetary policy and oil go two ways, and both are complicated. These inflationary developments, driven by energy, have several and intertwined implications in crudes markets and central banks respond to them.
The Dollar as a Transmission Mechanism
Oil is priced around the world in US dollars, and there is a structural relationship between the strength of the dollar and the price of oil. When the Fed is tightening, the dollar benefits, which increases the oil prices in the local currency for oil importers and tends to slow demand. In general, rate cuts tend to have the opposite effect, strengthening the dollar and giving some payoff to commodity prices.
A telling snag occurred late in 2024. The Federal Reserve lowered rates three times during the last months of the year, to a federal funds rate range of 3.75-4.5% from the high of 5.25-5.5% in the previous years.
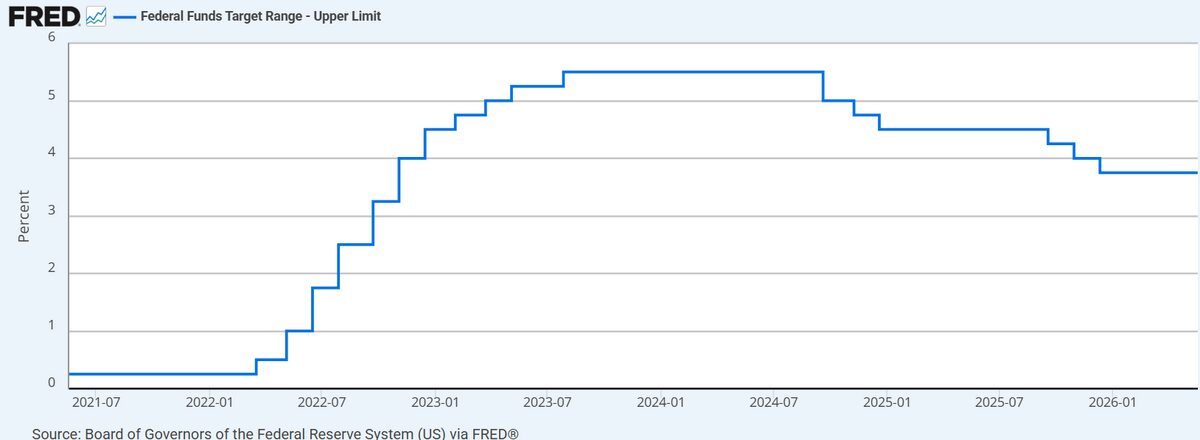
But the dollar did appreciate during that same time, as a result of the differing growth prospects of the United States and other big economies. Easing the way throughout that period had not helped oil prices, which have been under pressure for much of the time. While the correlation remained structural, there were some other factors that temporarily overpowered the dollar-oil relationship.
Real Interest Rates and Commodity Positioning
It’s important to note here the difference between nominal and real rates. The opportunity cost of holding commodities is affected by real rates (inflation-adjusted nominal rates). In 2020 and 2021, the real rates were quite negative, and commodity exposure was relatively sensible compared to cash. That changed when real rates went sharply positive during the 2022-2023 tightening cycle, and it was reflected in commodity positioning data in all of the energy futures markets.
The Policy Lag Problem
Rate hikes don’t have an immediate impact but instead take anywhere from 12 to 18 months to work through credit, spending, and employment decisions. The price of oil fluctuates within hours. This disconnect has often resulted in a situation in which a central bank is tightening because of high energy prices, yet prices come down significantly before the tightening has taken effect. The result can be an unintentional overkill in policy, which only comes to light once the energy impulse has passed.
When Tightening Meets Supply Constraints
The true challenge comes when there are supply-side influences raising oil prices as the central bank is tightening to curb demand-side inflation. Tools are not suitable for the problem. Rates can be used to suffocate demand, but cannot compensate for an OPEC+ production cut or an OPEC+ supply shortage due to sanctions. This can result in a concurrent rise in borrowing costs and a rise in energy costs, both of which are detrimental to growth and inflation’s remedy.
The 2022-2024 period was a prolonged, uncomfortable example of this.
Forward Guidance and Energy Market Reactions.
The dollar and growth expectations directly impact oil markets, and central bank communication in the form of statements, projections, and press conference language can indirectly impact oil markets even if there is no rate change. A hawkish FOMC statement may lift the dollar and lower crude in the same trading session. This is because there is a feedback effect for oil prices; they are partially reacting to the rate expectations, while that rate expectation is based on the inflation information, which in turn is partially reacting to the oil price. It is not a simple cycle to analyze in real-time.
Reading Oil Price Movements in Context
Each of the price behaviors has its own macro narrative, although why prices are moving is just as important as the direction. This gesture can signify many different things, depending on the intent.
| Oil Price Movement | Common Macro Interpretation | Key Limitations |
| Rapid rise on demand signals | Strong global growth, improving risk appetite | Can accelerate inflation; may invite policy tightening |
| Rise on supply disruption | Geopolitical tension or OPEC+ output cuts | Growth implications can be negative despite the price rise |
| Sustained decline | Weakening global demand, recession concerns | Reduces inflation pressure but reflects economic slowdown |
| Sharp drop on demand fears | Markets pricing in contraction | May precede a shift toward monetary easing |
| Extended range-bound trading | Balanced supply-demand; elevated uncertainty | Limited directional signal when viewed in isolation |
Analysts usually corroborate crude data with a number of other inputs:
- The U.S. dollar index (DXY) moves with rate differential expectations among important economies.
- From the demand side, PMI data for various countries in the world is available as a verification.
- OPEC’s production compliance data and actual production targets
- EIA weekly releases of data on the near-term supply-demand balance
These cross-checks matter. There is more reason to be skeptical of a crude price move that isn’t supported by some of these other indicators than one that fits with the other data.
Limitations That Deserve Honest Attention
The IEA’s October 2024 World Energy Outlook continued a pattern of the last few years: the importance of oil in inflation will likely wane over time in some industries, while renewables are rising in the power sector, and EVs are becoming more popular in key economies. The correlation between the crude prices and the CPI is not a constant but should be re-measured at regular intervals.
And there are a few other distortions to keep in mind:
- Short-term price movements may not be related to fundamentals, but instead driven by speculative positioning in futures.
- There is regular noise in the signal as a result of seasonal demand patterns, especially in the northern hemisphere winter.
- Intraday movements can appear large and be driven by algorithmic trading flows and/or options market dynamics.
Considering each day’s movement to be a macro indicator is a sure-fire recipe for bad analysis. When you look at the signal over weeks and months, and put it in a context with other data, with an explicit directionality as to what is motivating the move, it becomes clearer.
Conclusion
Oil is one of the most information-rich and responsive, continuous, and truly broadly receptive to a wide set of economic conditions at any particular moment. However, it’s more than just watching the price to use it well. In order to understand this, one has to comprehend the reason for each move; confirm from other indicators, and be aware that the routes by which oil is transmitted to markets are gradually shifting in the new global energy landscape. It’s a good place to begin. It’s typically not a full solution by itself.
Disclaimer
The information in this article is intended for general information and education only. It is not intended to provide financial, investment, or purchase/sell/hold advice on any financial instrument such as crude oil futures, commodity-linked funds, equities, or derivative products. The history of macroeconomic relationships does not predict future relationships. Investing in any kind of financing comes with its risks, and it is possible to lose all of the investment. Any investment or trading activity is highly recommended to be preceded by the reader’s own independent research and to seek advice from a qualified financial professional. The author and publisher are not responsible for decisions based upon the information contained herein.
This article contains a press release from an external source. The opinions and information presented may differ from those of DailyCoin. Readers are encouraged to independently verify the details and consult with experts before acting on any information provided. Please note that our Terms and Conditions, Privacy Policy, and Risk Warning have been recently updated.