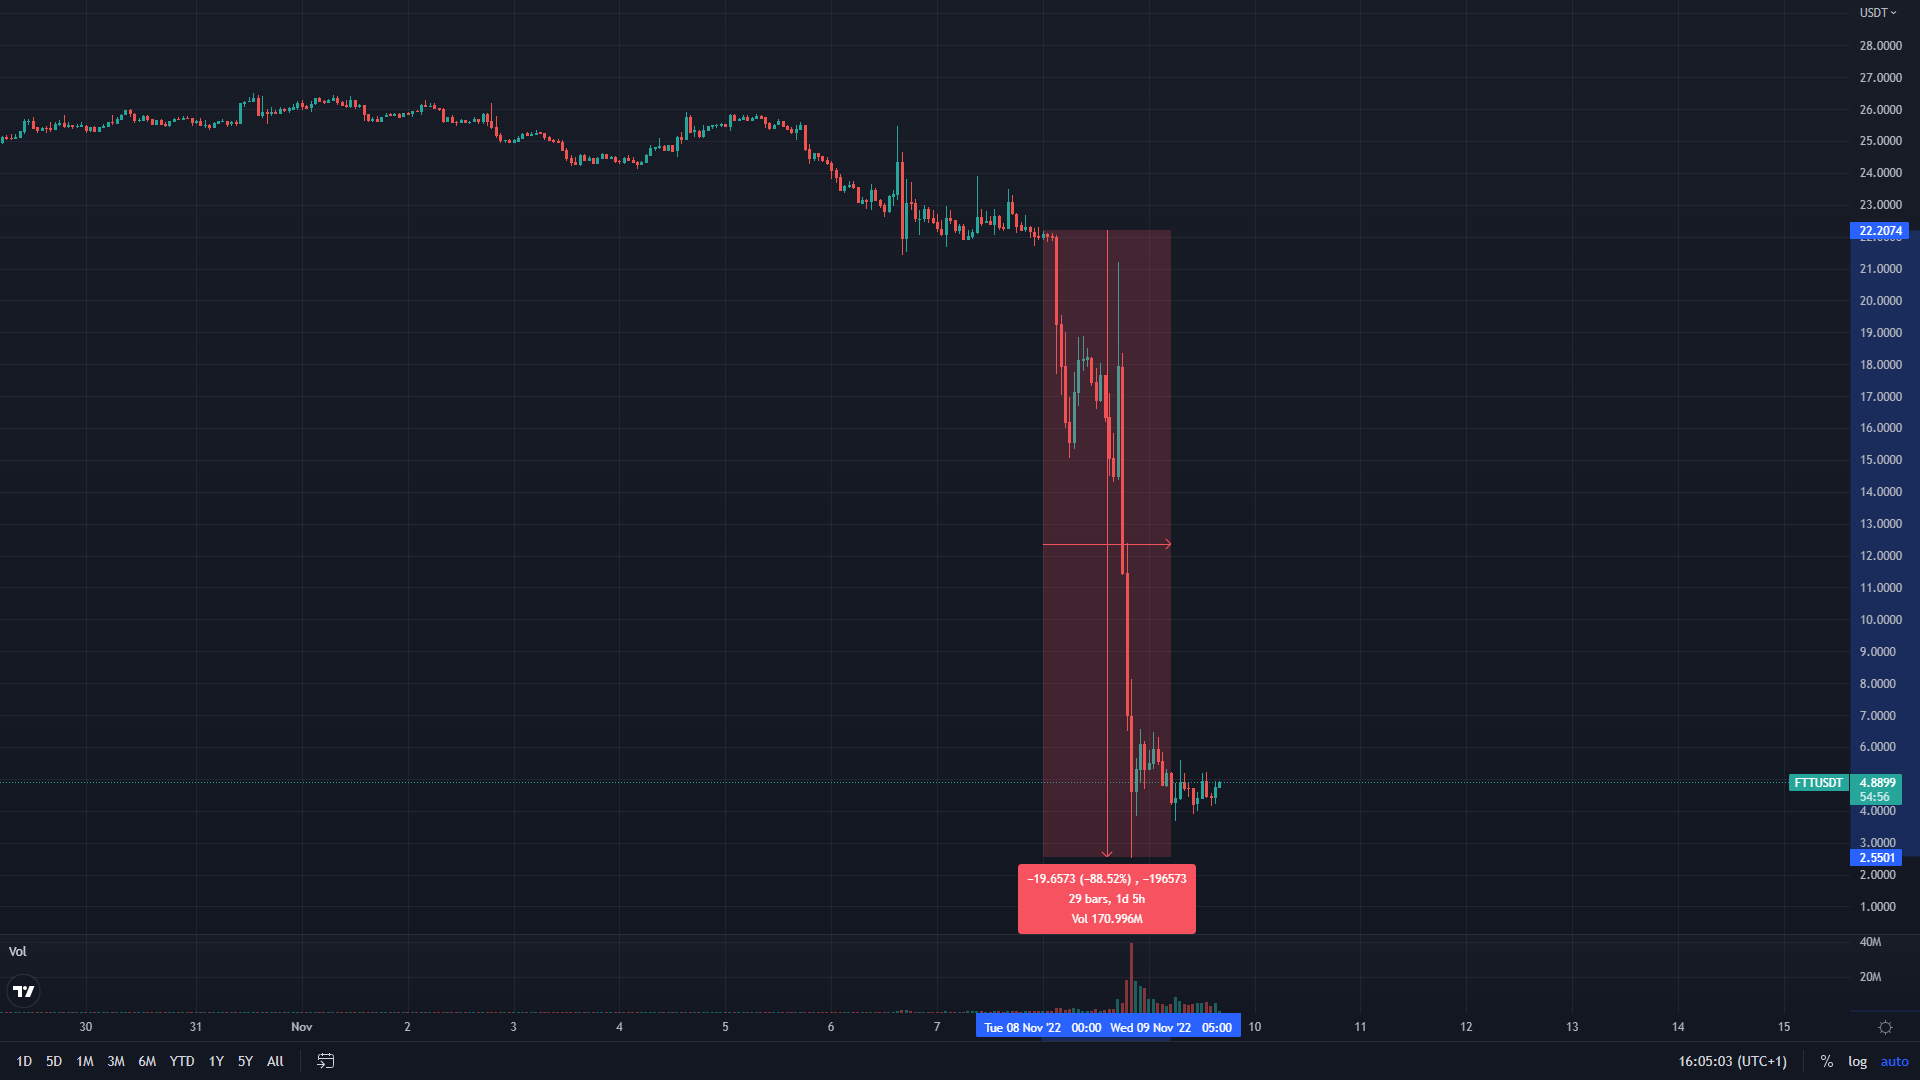
The price of the FTX Token (FTT) has plummeted by 90.93%, as measured from Tuesday’s open at $22.2 to its lowest point of $2 on Thursday morning. At the time of writing, it is being traded at around $3.29, and has started slightly recovering.
There is still much speculation about what exactly happened with FTX and what its future is. Binance is not stepping in after all, and with the recent price crash many investors are now asking “Is the FTT token headed to $0?”

FTT/USDT
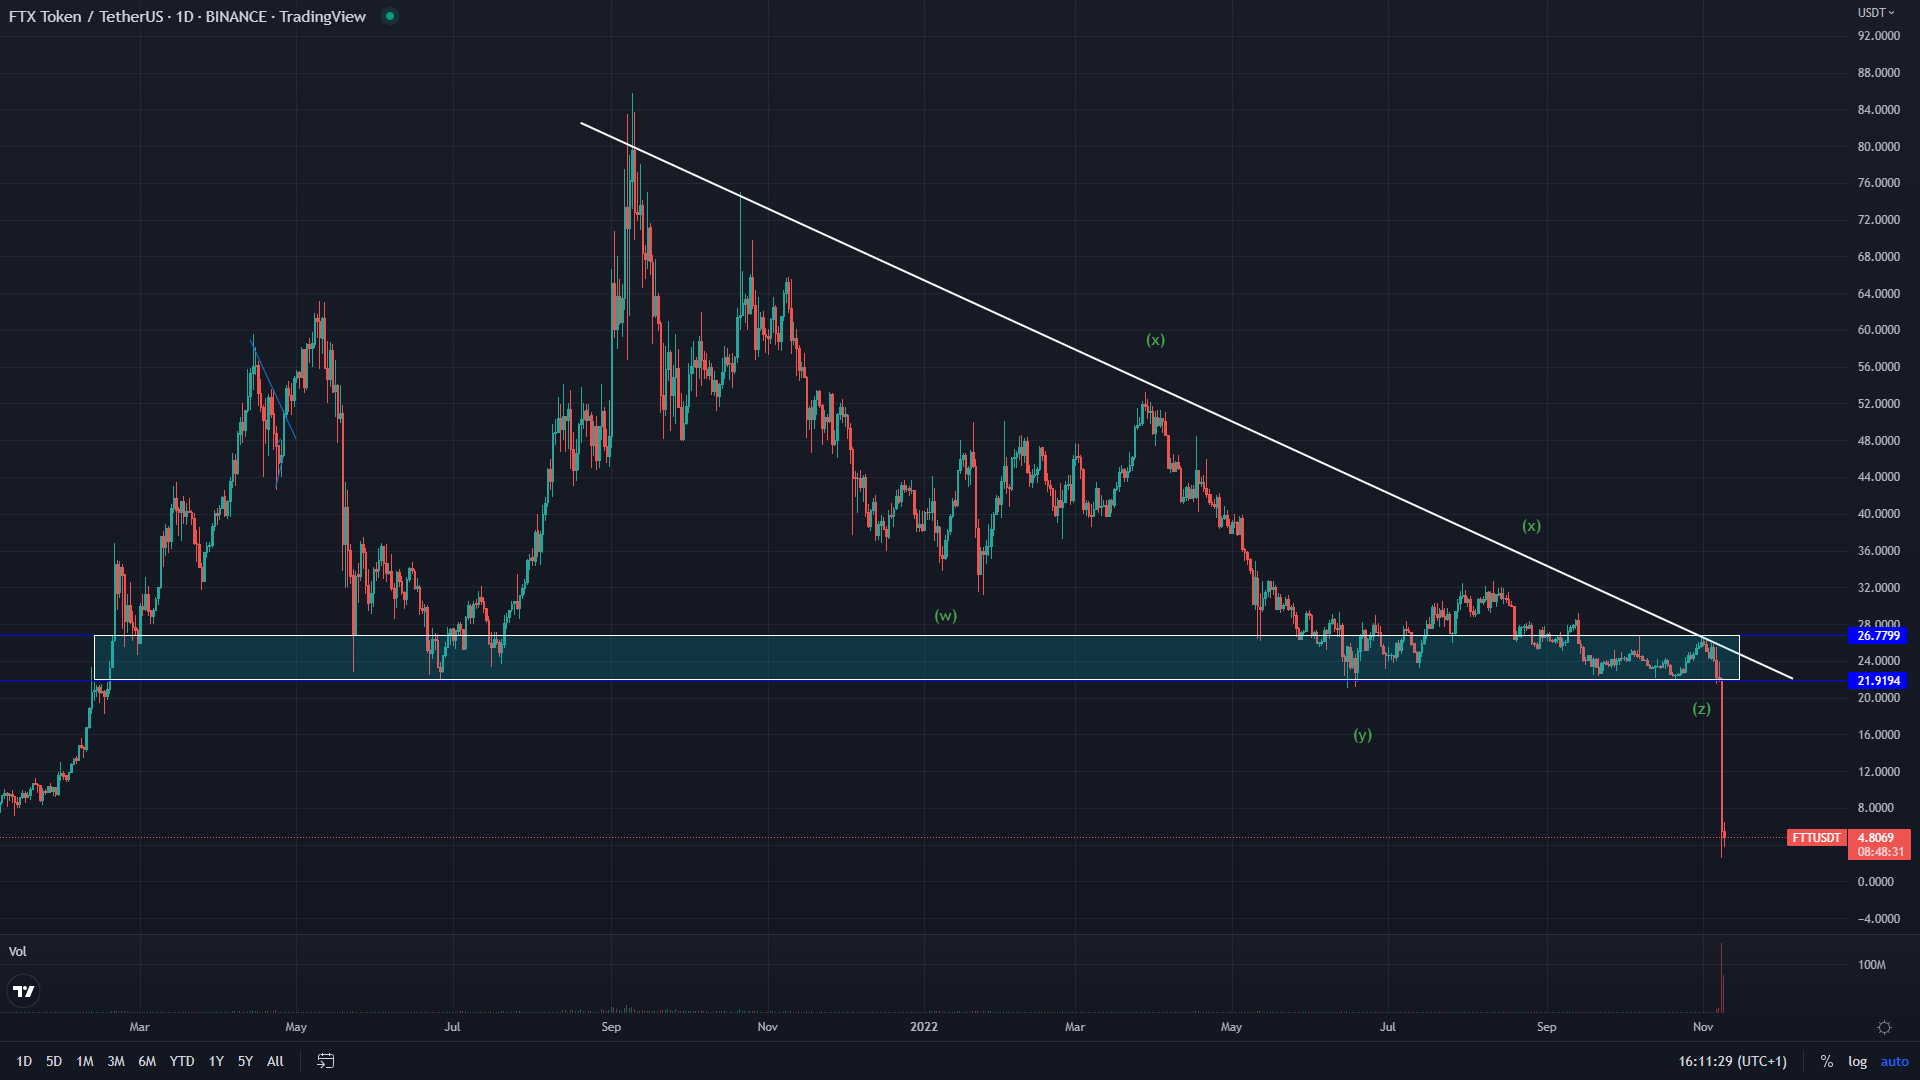
FTT token was in a correction since the 8th of September 2021, when it reached an all-time high of $85.78. Entering the bear market in November, the token followed the general sentiment and continued on to form a downtrend.

Reaching $21.64 on Jun 18th this year at that time was the sign that the price could find support and establish a horizontal range in which to consolidate. This low comparable to the June 21st, 2021, and was viewed as a potential bottom.
Sponsored
From the 18th of June, a recovery was seen and the price made an attempt to start an uptrend. This ultimately failed, making another lower high on the 14th of August at $32.1.
This lower high even hasn’t interacted with the significant descending trendline that dates from the all-time high, pointing out signs of struggle and strong selling pressure.
Sponsored
In conjunction with the horizontal zone at around $21, the descending resistance trendline made descending flat triangle formations. This pointed out that the correction might just be ending shortly after another retest of the June 18th low.
On September 22nd the horizontal level managed to hold, and a bounce was made. The price was propelled in another attempt to make a breakout to the upside, but yet another rejection occurred at the descending trendline on the 1st of November at $26.5. This was an intersection between the upper resistance of the horizontal range and the descending resistance line.
A downside turn was expected, but definitely not with this much momentum. Now that the price is being traded below every historical data reference we are kept in the dark, guessing where the bottom could be, and can it go to $0?
Where Is The Bottom?
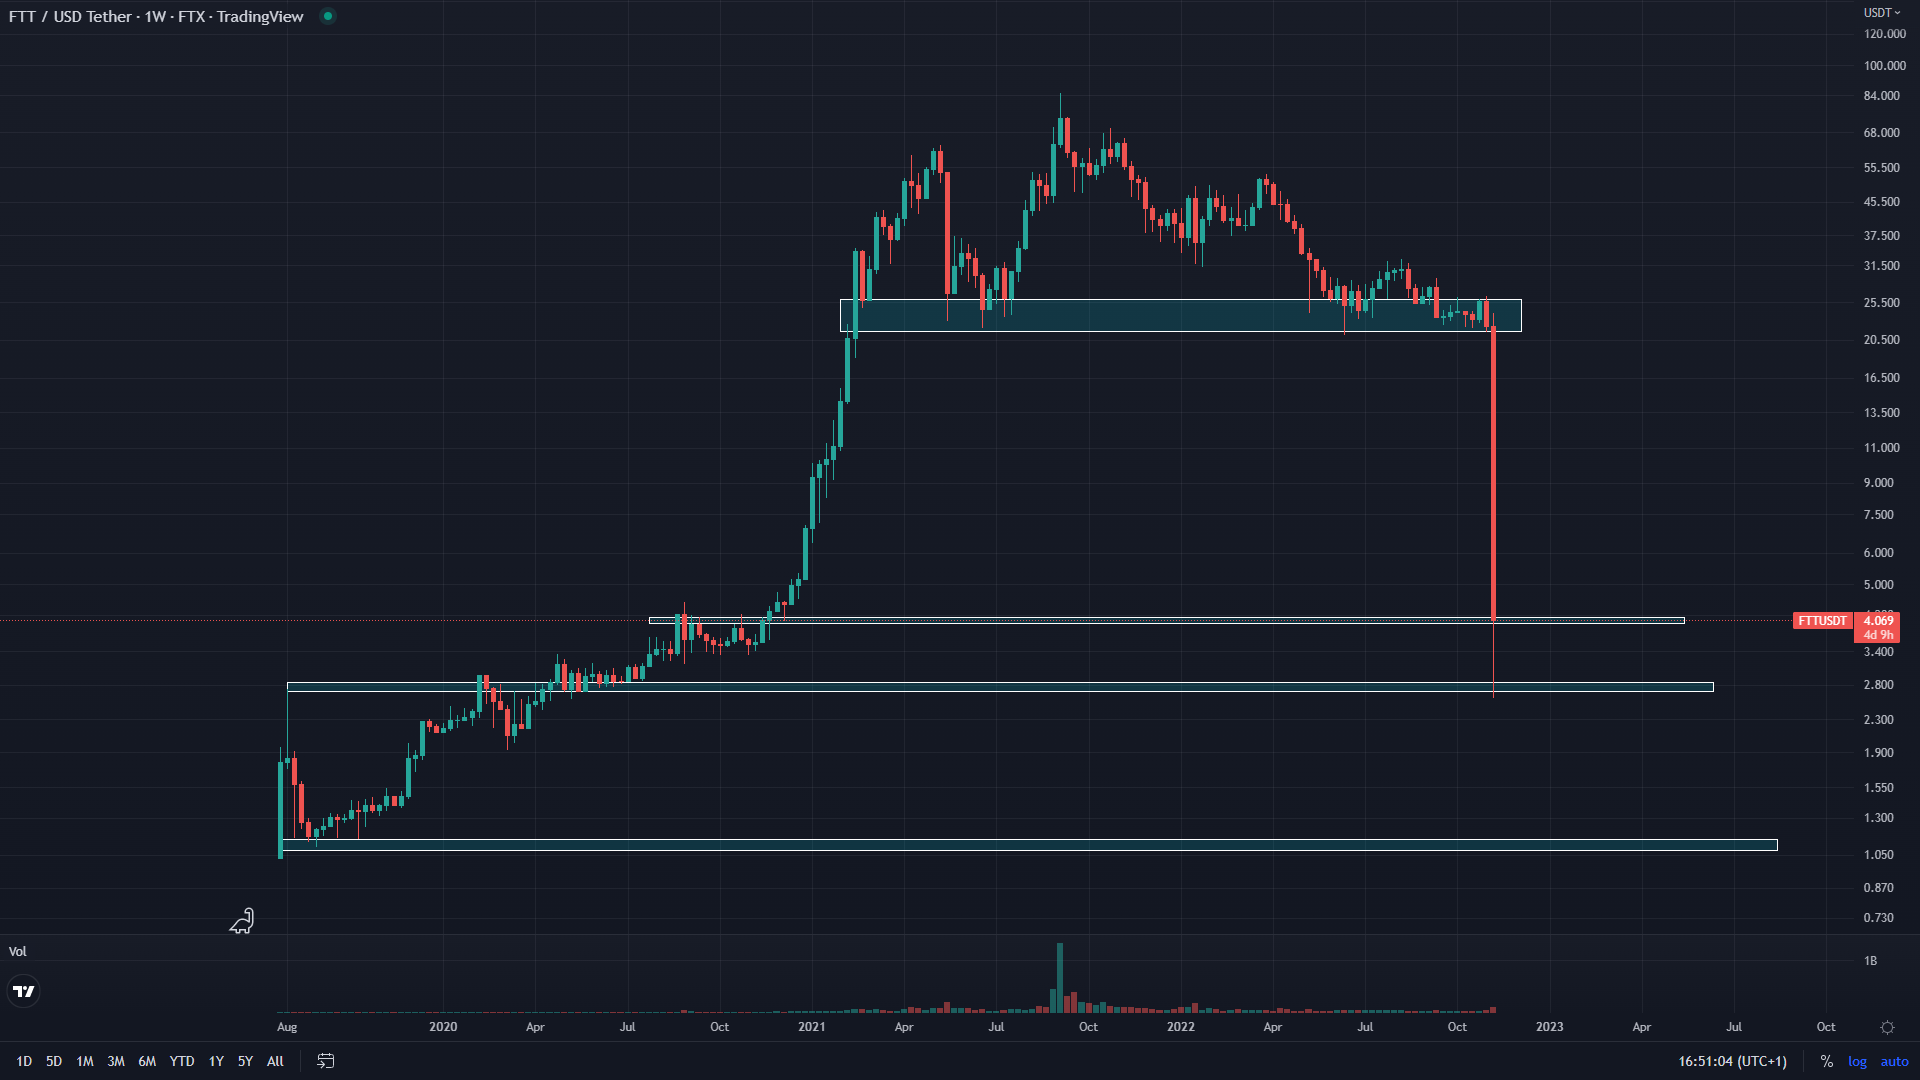
Looking at the weekly timeframe, we can see the price of FTT has three more zones of interest that it can land on. We are days away from the weekly close, which is why it is very important for the price to maintain above $4.6 for any hope of the FTT token remaining relevant.

If this doesn’t hold, the next possible target would be in the $2.6 range. However, these ranges aren’t especially reliable. Additionally, considering the fact that they were formed in 2020 it is still unclear whether they are still relevant.
It is interesting that the price is currently back to the level where it was pre-pump, back in November 2020. This is another factor why maintaining over $4 on the weekly close is of utmost importance.
Unfortunately, if this level doesn’t hold and we don’t see the weekly candle close above it, further downside is expected.
The price of FTT when entering the market on the 29th of July 2019 was $1.7. For now, we can only view this as the actual bottom. What does that mean?
As long as there is one person or entity holding the token it can’t go to $0. And Alameda research and FTX exchange are still big players, regardless of the recent developments.
The price going to $0 would mean entirely shutting down the exchange and burning the token out of the market, which might happen. But from a purely technical analysis standpoint, this is irrelevant, as in that case we wouldn’t be looking at the chart.
Conclusion
Even though the price of FTT plummeted, it has already reached some key horizontal levels. The most notable is the $2,6 zone but is crucially maintaining above $4. If the weekly candle manages to make a close above it, then it could signal a potential bottom.
But if we have already seen the price going all the way down to its starting point on the wick, the overall picture looks grim.
Binance is not going to proceed with its LOI, and the exchange might go bust, failing to enable their investor to withdraw funds. In such conditions, FTT could easily be rendered useless and end up at $0.
