

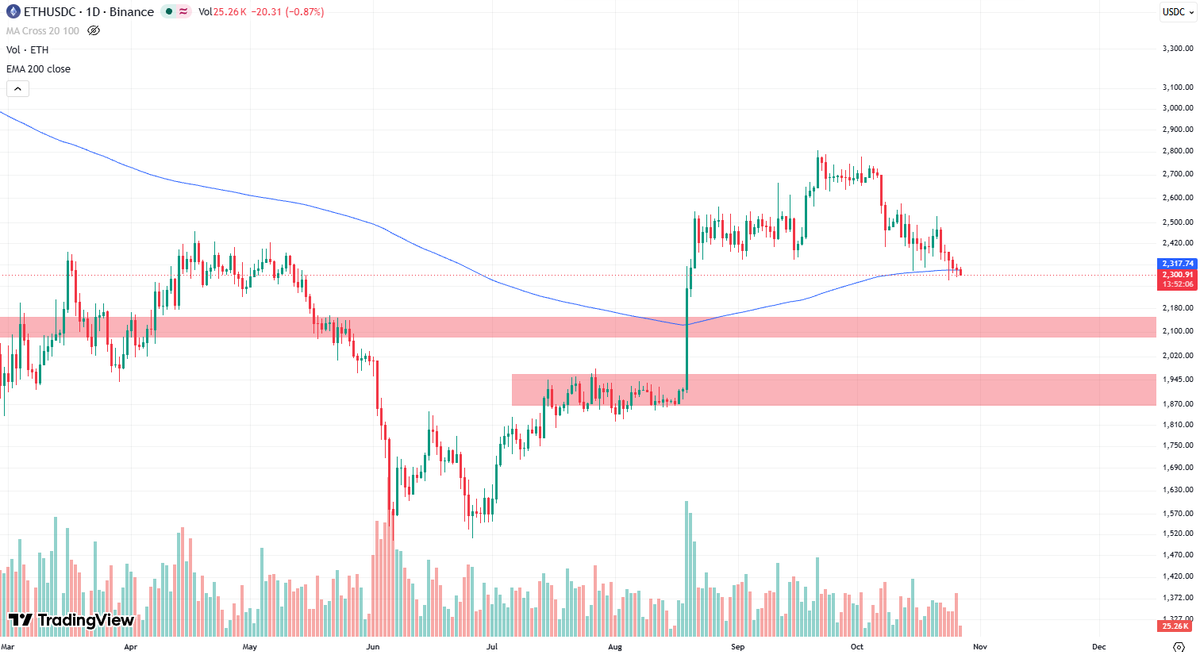
- Ethereum (ETH) price is testing 200-day EMA support near $2,317 after a rejection at $2,730.
- US spot ETH ETFs recorded $88.58M in net redemptions on Oct. 26 alongside Ethereum Foundation sales.
- Analysts warn ETH could fall toward the $2,200 level to find a bottom zone.
Ethereum (ETH) finds itself at a critical technical juncture, struggling to maintain its position as broader macroeconomic pressures and crypto-native headwinds combine to weigh on market sentiment.
Trading at $2,310 on October 27, the Ethereum price is actively testing dynamic support at its 200-day Exponential Moving Average (EMA) near $2,317.83—a crucial threshold for preserving its long-term structure. Market analyst Ted Pillows warned on X that ETH “looks like it wants to dump more,” pointing out an absence of buying power and suggesting a retest of $2,200 could be next.
Weak Liquidity and ETF Outflows Pressure ETH
Macroeconomic conditions continue to exert pressure across digital asset markets. Bitcoin and Ethereum continue to trade in tight correlation with major AI and technology stocks, which faced heightened selling pressure heading into late October earnings reports.
Sponsored
According to research from 10x Research, capital flows into the crypto market have weakened significantly. USDT market cap slipped 0.5% week-over-week to $182.6 billion, while USDC contracted 1.2% to $71.5 billion.
Total stablecoin supply fell by $1.9 billion over the previous week, and net redemptions over 30 days reached $4.8 billion. The firm said its stablecoin minting indicator sits in the 2nd percentile, a reading it characterized as severely bearish.
Institutional actions reinforce this cautious outlook. Data from SoSoValue shows US spot Ethereum ETFs recorded net outflows of $88.58 million on October 26, even as spot Bitcoin ETFs registered modest inflows of $110.34 million. Simultaneously, on-chain tracking reveals the Ethereum Foundation sold $6.43 million in ETH on the same day.
Crypto investor and analyst Ted Pillows said on X that Ethereum shows no strong buying and that every support zone is being lost. He called $2,200 the likely bottom zone.
Ethereum Price Outlook: Key Levels to Watch
Following an August breakout from ~$1,850 to highs of $2,700–$2,750, Ethereum entered a multi-month consolidation pattern.
However, an October rejection at the $2,700–$2,730 resistance zone formed a series of lower highs and lower lows, driving ETH price back down to the 200 EMA.
Notably, recent selling volume remains below average (24.92K vs. the 30-day average of 74.72K), indicating that while selling pressure is exhausting, aggressive buying volume is also absent.
Key Short-Term Scenarios
A daily close above the $2,300-2,317 support zone could set the stage for a rebound toward resistance between $2,430 and $2,510. A break above $2,510 could open the way for a retest of the $2,750 high.
Conversely, a decisive close below $2,300 would signal a breakdown below the 200-day EMA, potentially exposing support between $2,100 and $2,150. A deeper decline could bring ETH price back toward the $1,850-1,900 range.
Why This Matters
Ethereum (ETH) is sitting directly on its primary long-term trendline while liquidity indicators, stablecoin supply, and ETF inflows remain subdued. How ETH price closes relative to the $2,300 threshold over the coming daily sessions will likely determine its direction heading into November.
Dive into DailyCoin’s popular crypto news today:
$1.8 Trillion Franklin Templeton Files for Two ETFs Linking Stocks and Bitcoin
Bitcoin Under $80K: Key Floor Test Ahead of High-Stakes Fed Week