
Prominent crypto analyst Ali Martinez is drawing parallels to Cardano’s (ADA) current market structure with the 81% downturn earlier for one simple reason. The Moving Average Convergence Divergence (MACD) trend-line has just crossed over to the bearish zone.
Last time that occurred, Cardano’s (ADA) price slumped by 81%, while the current market dip has already manifested itself in a 32% pull-back. Mostly driven by Bitcoin’s (BTC) dip to $85K, but not just that. Are other key on-chain stats falling in place with this dim theory?
Mostly Bearish, But One Key Metric Favors ADA
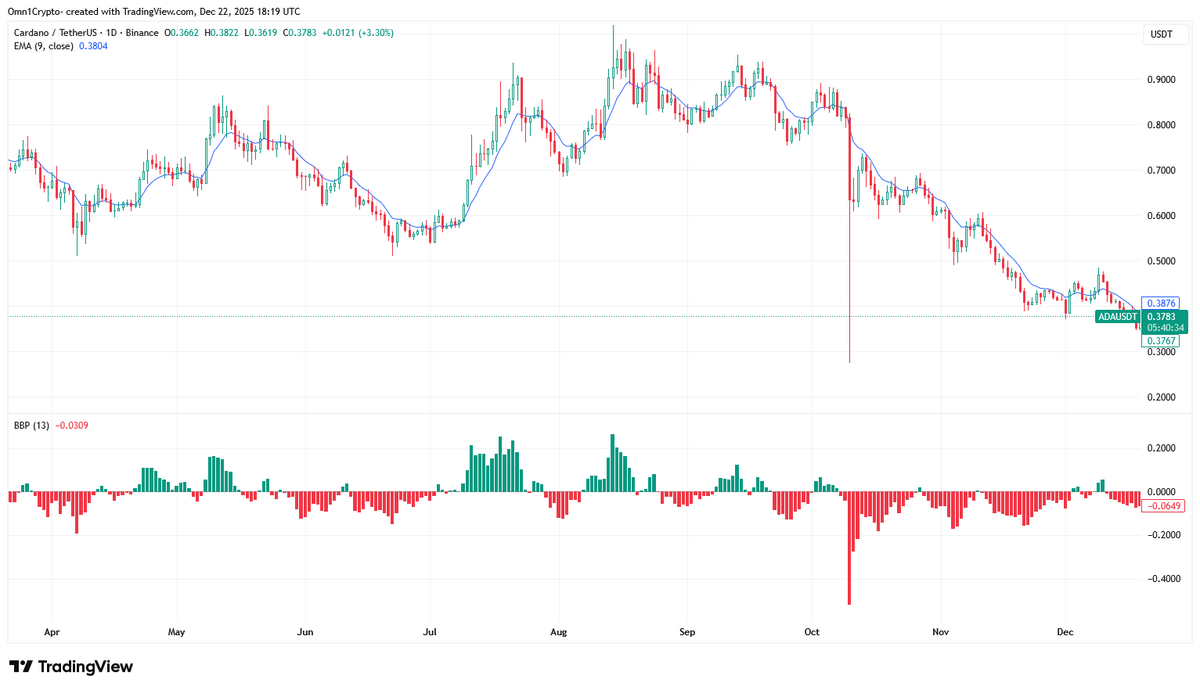
The Exponential Moving Average (EMA), another key trend-line, was positioned at $0.38, just fractions below the current ADA price. Bull Bear Power (BBP), a crucial indicator of the current sentiment, has also hovered slightly in bearish territory.
For Cardano bulls, ADA’s rebound probability mostly relies on the success of Midnight (NIGHT), an alternative Cardano ecosystem token. Midnight’s side-chain was launched just a couple of weeks ago, blasting the self-titled altcoin beyond 200%.
Cardano whales, the largest investors with balances beyond $1 million, aren’t convinced of an immediate Cardano price rebound – marked with the Chaikin Money Flow (CMF) still dwelling in negative territory. However, there’s one positive sign.
The Stochastic Relative Strength Index (StochRSI) is in massively oversold territory, implying that the OG altcoin is under-valued against market peers. Dropping gradually from the $0.90 price tag since mid September, Cardano’s $0.37 support could take shape in a Cardano bull run if big-time investor buying appetite returns.
Discover DailyCoin’s hottest crypto news today:
Big For XRP? SWIFT Talks “Come Together” Blockchain Push
Hedera’s HBAR Bleeds, But Institutional Deals Quietly Stack Up
People Also Ask:
The tweet highlights a bearish MACD crossover on Cardano’s monthly chart, where the MACD line crosses below the signal line and signals potential downward momentum.
Ali Charts points out that the previous MACD crossover triggered an 81% price drop in Cardano, while the current one already drives a 32% decline.
The chart displays Cardano’s monthly price action from mid-2023 to late 2025, with the price falling to around $0.41, and the MACD histogram at the bottom confirms the bearish shift.
Users react mixedly: some support the downside warning, others dismiss it as outdated or irrelevant, and a few promote alternative cryptocurrencies like XRP.
Investors should always consider technical signals like MACD as tools only, and always combine them with Cardano’s ongoing upgrades, adoption metrics, and broader market trends before deciding.