
Peter Brandt, the stock trader with over 50 years of experience, is calling a double top on XRP’s price. “I know in advance that all you Riplosts XRP will forever remind me of this post”, uttered the trader, showcasing a weekly Ripple (XRP) price chart with a double top around $3.30 – $3.50.
XRP’s Below $2? Big Dip Coming, Says Brandt
This almost falls in line with the freshest all-time high of $3.65, inked last Summer. A similar structure was seen back in 2018, when XRP whipped up the $3.50 price tag for the first time ever. The bearish implications might magnify if Ripple’s market value keeps below the $2 support line.
Otherwise, trading sub-lower boundaries can inflict additional selling pressure among both retail & large-scale players. Typically, a double top in crypto trading resembles the letter ‘M’, as the underlying asset’s price gets rejected at a similar range. In both instances, XRP’s $2 neckline plays the decisive role.
XRP Can Still Dodge The Bears If This Plays Out
Technical implications show that XRP’s price bounced off the lower-tier Bollinger Band (BOLL) at $1.83, depicted in green color. However, all of the other key trend-lines are positioned well above the current Ripple coin price, so bulls won’t be regaining the steering wheel soon.
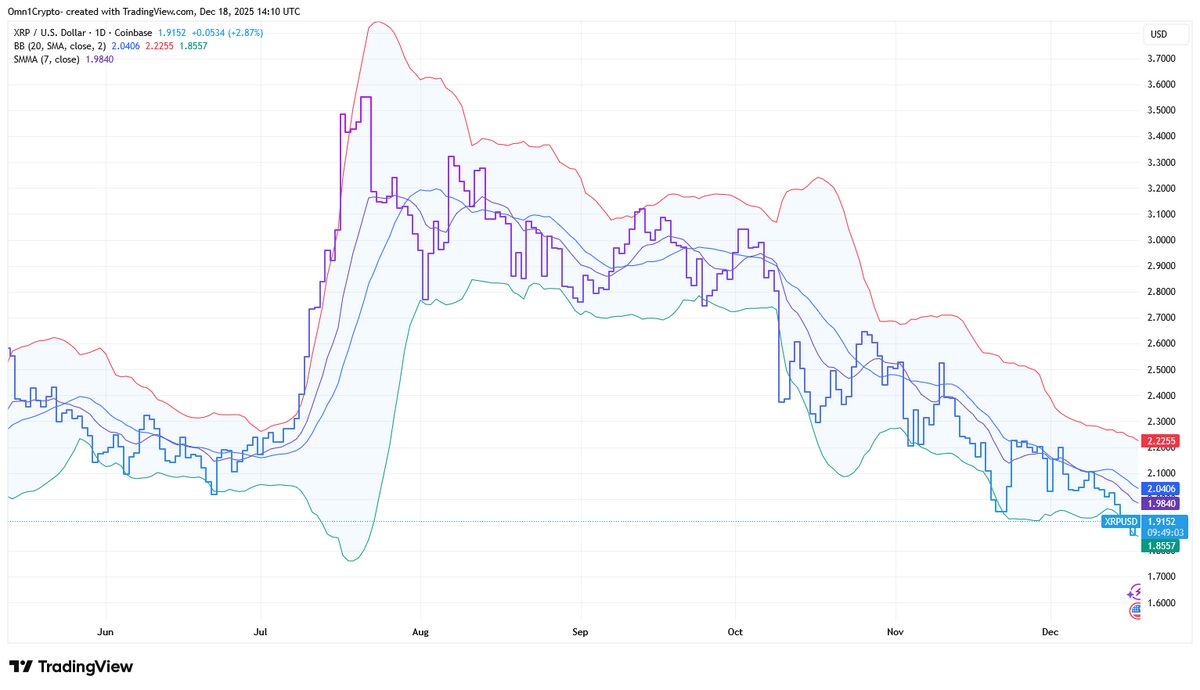
Not until XRP coin’s price restores the Smoothed Moving Average (SMA), located at $1.98. With major crypto investors still feeling sloppy, the Chaikin Money Flow (CMF) is in severely negative territory, flashing -0.14 as of press time. So, for Peter Brandt’s bearish thesis on XRP’s price to invalidate, XRP’s price must close the week above the red-label Bollinger Band of $2.22.
Delve into DailyCoin’s popular crypto news today:
Shiba Inu Flashes Double Bottom Upon Big Coinbase News
Pi Coin’s Price Risks 30% Downside Unless This Happens
People Also Ask:
Brandt identifies a potential double top on XRP’s weekly chart, formed by two peaks around $3.50 this year, with the neckline support near $2 now broken.
Double tops signal reversal after failed attempts to break higher resistance; a confirmed break below the neckline often leads to significant downside, shifting momentum from bullish to bearish.
Measured moves from the pattern suggest potential drops to around $1 or even lower (some calculations point to $0.40–$0.50) if support fails to hold.
Price trades below the $2 neckline (around $1.83–$1.89 recently), threatening confirmation; a weekly close below solidifies the bearish shift.
Yes—Brandt notes it may fail; a strong reclaim above $2 with bullish momentum would invalidate the setup, potentially sparking a rebound (aided by oversold RSI at ~33).