
Our pick of the day is Enjin Coin. We will provide you with our detailed technical analysis using two-time frames, the daily and the four hour. By looking at the higher time frame, we will know what is the main direction of the trend. By using the lower one, we will identify the best time to execute our trade.
We will start by analyzing the daily time frame, and then we will move to the four-hour one to provide you with two possible scenarios of how Enjin Coin might move.
Market Overview
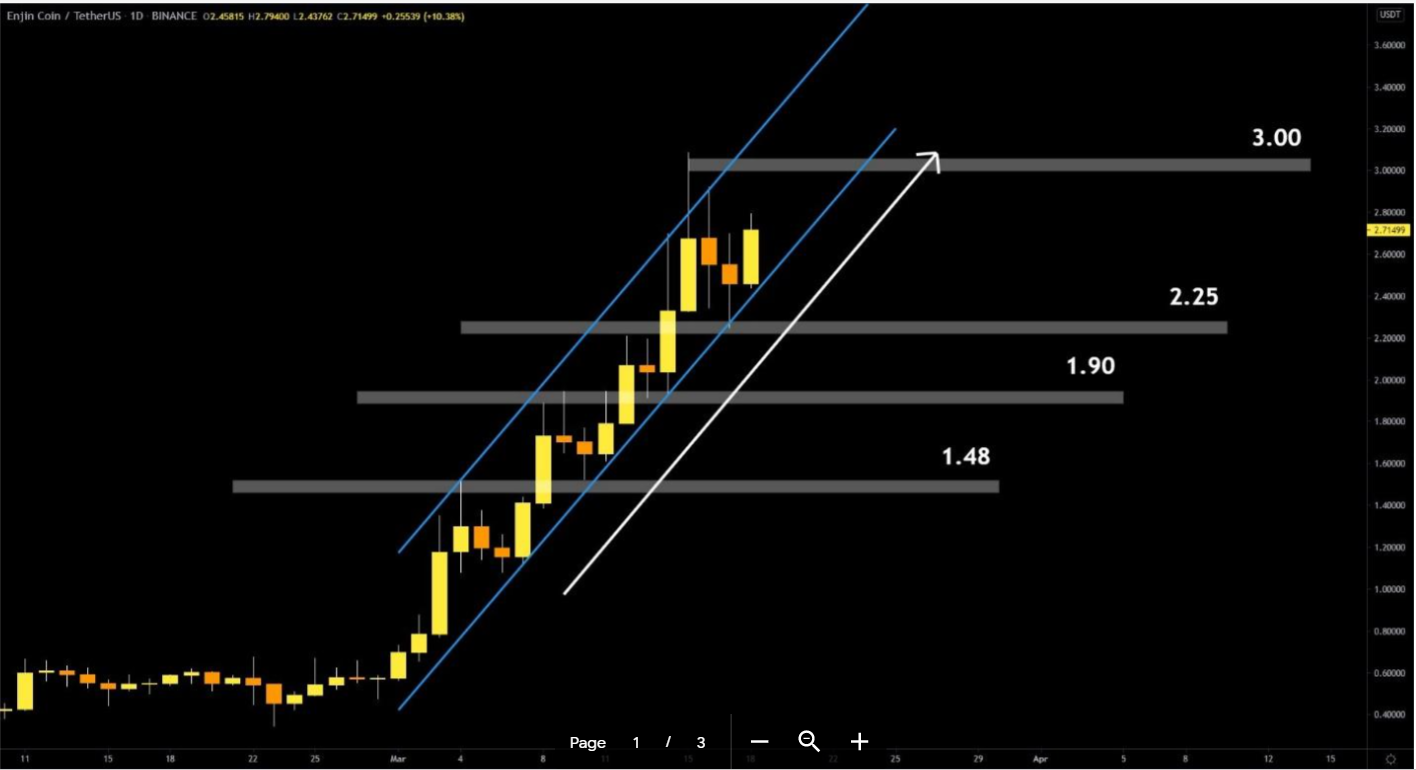
On the higher time frame, we can see that the price is in an upward movement where the coin is trading inside a bullish ascending channel and posting higher highs and lows. So, if we focus on the last move, we can notice that on the 14 th of March the price successfully broke the 2.25 USDT resistance level. This
mark now is a strong daily support when the price heads toward it.
Sponsored
Now, we will lower our time frame to come up with two possible scenarios.

Long Scenario
A move upward is what will probably happen next since the main direction of the trend is to the upside, so the odds are in your favor if you consider a long position.
Now, let’s dig deeper into what’s happening in the lower time frame.
Sponsored
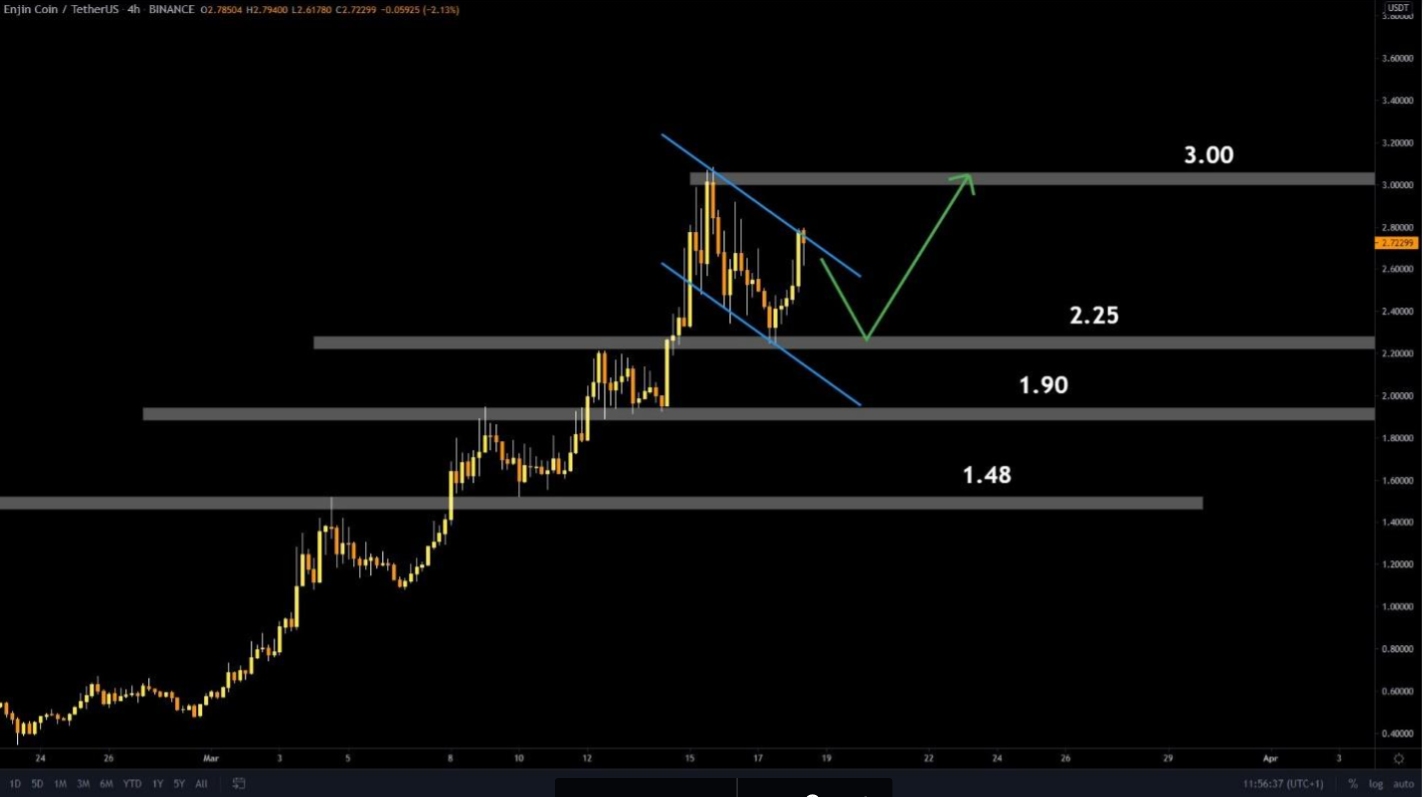
The price on the four-hour time frame is trading inside a bullish flag formation. This shows that the coin is posting a form of correction before it rallies again and moves to the upside.
If our analysis is right, we might see a direct move upward from the current market price to the 3 USDT level. However, there is another possibility here, which is that we could see a continuation of the correction pattern. In that case, the price will head to the lower end of this flag formation, to the 2.25
USDT mark, before moving upward again to the 3 USDT mark.
This is our first scenario; let us now discuss the short one.

Short Scenario
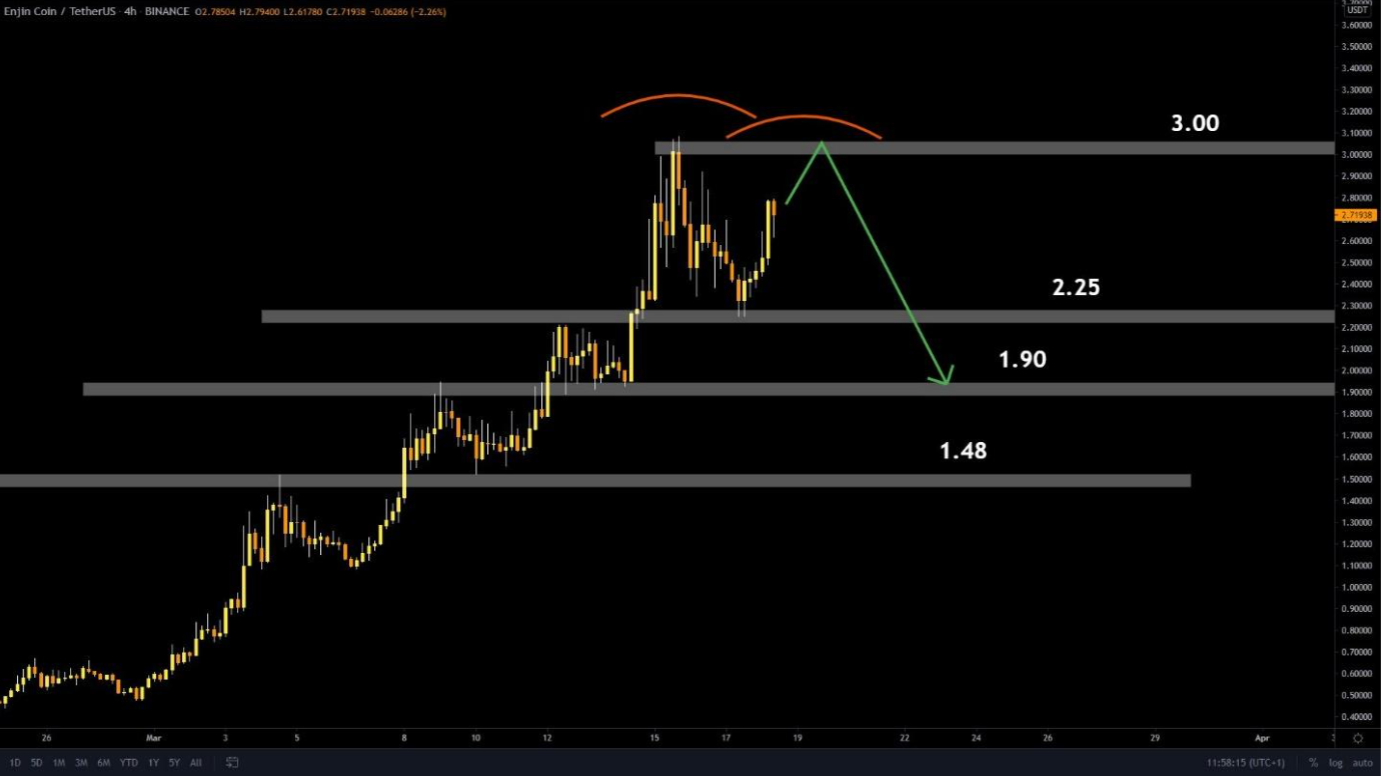
If the price manages to continue upward to the 3 USDT price level, there is a huge probability that the market will stall around this mark. So if the coin does not break and close above the 3 USDT level, a double top will be formed. This common type of pattern signals that a potential reversal might occur,
and this could lead to a move lower to test the 2.25 USDT mark. This is our first target, but if the sellers overwhelm the buyers around 2.25 USDT, a breakout to the downside might be seen, and then our aim
would be 1.90 USDT.
Indicators Used for Our Analysis
To complete this technical analysis, we implemented the double top formation along with the ascending bullish channel, and, as always, we used the price action to study the formation of each candlestick.
That’s it for today’s pick, please trade safely.
